Contents
8.1 Introduction
What the chapter asks
Chapter 6 described the Tropical Forest Investment Fund as the Concept Notes present it. The fund is to hold $125 billion, of which $25 billion comes from sponsor governments and $100 billion is borrowed from institutional investors. The money is then invested in bonds. Concept Note 3.1 permits bonds from developed as well as emerging markets (p. 38), but its projection and its risk analysis are built on a core of emerging-market bonds (p. 41), and that is the portfolio this chapter tests. Each year the fund pays its lenders, and whatever is left is transferred to the Facility for Forest Payments. Chapter 7 examined the incentive mechanism those payments are meant to support and found it well designed. This chapter asks two questions about the fund itself: how much it can be expected to transfer to the Facility in a typical year, and how reliably it can be expected to make these transfers.
The $4 billion target
The Facility is designed to pay $4 per hectare of standing tropical forest, and the countries eligible to join hold more than one billion hectares.1 The target payment amount is therefore about $4 billion a year. Concept Note 3.1 puts the initial requirement at $2 billion, but only because of discounts or non-qualification. Countries with a deforestation rate above 0.5% a year do not qualify at entry, and in the countries that do qualify the discounts of 100 and 200 hectares for every hectare lost reduce the area that is paid for. Together the two rules leave only about 500 million hectares expected to be eligible at launch.2 The $2 billion is therefore a starting point. If the mechanism works, deforestation slows down, more countries invest in forest protection in order to qualify, and the payment rises toward the $4 billion paid at zero deforestation. The sponsors’ capital does not grow with it. The $25 billion is fixed, and the growth the Note projects comes from the earnings the fund retains and from the further borrowing those earnings support, which we come to below.
The Concept Note's own arithmetic
For the $2 billion, the Concept Note gives its own arithmetic. “For a $125B levered portfolio to produce $2B in excess cashflow, it will be required to have a net excess spread of 160 bps. This is what the TFIF must generate net of paying for its cost of capital and fees.”3 It estimates the cost of capital at “72-140 bps over the reference UST” and expenses at “15-25 bps,” both on the full $125 billion, and concludes that “a portfolio generating between 247 bps and 325 bps of gross spread over UST would be necessary.” Its cash-flow projection assumes 350.4 For $4 billion the same arithmetic requires 320 bps net, or 407 to 485 gross. That is more than the projection assumes. Table 8.1 sets out the figures.
Table 8.1. The Concept Note’s required spread, bps on $125 billion
| Item | To pay $2 billion a year | To pay $4 billion a year |
|---|---|---|
| Net spread required, after the cost of capital and expenses | 160 | 320 |
| Cost of capital | 72 to 140 | 72 to 140 |
| Expenses | 15 to 25 | 15 to 25 |
| Gross spread required over Treasuries | 247 to 325 | 407 to 485 |
| Gross spread assumed in the Note’s projection | 350 | 350 |
Source: Concept Note 3.1, §7.5, pp. 40–41, for the $2 billion column and the projection; the $4 billion column is the authors’ calculation by the same arithmetic.
A projection that does everything at once
The projection, Figure 10 of Concept Note 3.1 (p. 41), offers a rosy view of a steadily growing fund. The fund is rapidly capitalized and reaches $125 billion by its fourth year, and then grows consistently for forty years to hold more than $200 billion, while its market borrowing rises with it; it pays forest countries around $2.2 billion in the first full year, rising to about $6 billion a year by year forty; and it repays the sponsors’ $25 billion out of retained earnings over the same period, so that by year forty it holds its own equity in place of theirs.5 Growth, rising payments and repayment are supposed to come from the same 350 bps.
Three ways to test it
Section 8.2 explains what the difference in yield between emerging-market bonds and US Treasuries represents, and why not all of it can be collected. The sections that follow use three different models to assess how much the fund could pay to the forests (and to the sponsor countries). The first, in Section 8.3, is the Concept Note’s own arithmetic with historical averages in place of its assumptions: what emerging-market debt has actually paid over Treasuries since 2000, less what the TFIF would pay to borrow and what it would cost to run. The second, in Section 8.4, is a set of simulations. It puts the averages aside and runs the TFIF day by day through the market history of 2000 to 2026, to see what the fund would have paid and what would have become of its capital. Because the starting date turns out to be quite important, our simulations include a launch in each year from 2000 to 2018. The third, in Section 8.5, repeats the arithmetic of the first on the spreads available in September 2026, to ask what would be left if the fund were launched now. None of the three is a forecast. The first and the third rest on an average or on one month’s prices; the second follows prices in the order they came, but through only one stretch of history.
The findings in brief
The three approaches lead to the same conclusions. First, the fund would not have paid what the Concept Notes promised had it been launched in the past, and it could not do so at the spreads available now. On the returns earned since 2008 it would have had $0.2 to $0.4 billion a year for the forests, and on the spreads of 2026 at most $0.8 billion, against a starting promise of $2 billion. Second, the payments are not reliable. In the simulations the fund paid between half and three quarters of what was scheduled. It paid in full in about half of the years and nothing in nearly two years out of five, which is not a basis on which a government can plan a programme. Third, the outcome depends on the year in which the fund happens to start and on what markets do afterwards, although its underwriters, managers and bondholders are paid in every case. Fourth, the fund tends to shrink. In good years its surplus goes to the forest countries, up to what they are owed, and in bad years it cannot refinance its bonds and has to repay them. Sponsor capital was impaired in every simulated launch, and sponsors should expect that much of it will not be repaid.
Conventions, and the order of payment
Before turning to the evidence, we set out the conventions used in this chapter. Yields, spreads and fees are given in basis points (bps). A basis point is one hundredth of a percentage point, so 100 bps is 1.00%; small differences matter greatly when they affect $125 billion. Where the Facility supplies a figure we use it; where it supplies a range we say which end we think plausible and why, and where the choice matters we show both. Our focus in this chapter is the fund, the TFIF, though we also include the costs of running the Facility itself, which are dealt with more thoroughly in Chapter 10. One feature of the design should also be kept in mind throughout. The fund’s income is paid out in a fixed order: fees first, then interest on the senior bonds, then interest on sponsor capital, and the Forest Payment last, from whatever remains. In a bad year, the Forest Payment is the first thing cut.
8.2 What the spread represents
The business model
The TFIF’s business model is to borrow at one rate and invest at a higher one. Concept Note 3.0 gave the example plainly: “the current yield of a representative USD-denominated portfolio of bonds from EMDE countries with an average rating of BB+ and maturity of 10+ years is 8.3%. If TFIF’s average cost of capital is 5.3%, the positive spread available for payment to TFCs would be 3.0%. In this example, a USD 125 billion fund after costs and provisions would generate approximately USD 3.4 billion per year, on average, of cashflow that would be available to TFCs.”6 Three percent of $125 billion is $3.75 billion; the note deducted $350 million for costs and provisions and kept the rest. In financial markets this strategy of borrowing to invest is called a carry trade. It is not new, and nothing about it is specific to forests.
The price of default
The three percentage point differential existed because lenders believe the borrowers are more likely not to pay. A bond issued by a country rated BB+ yields more than a US Treasury bond because there is a real chance that the country will default, that its debt will be restructured at a loss to bondholders, or that the bond’s price will fall sharply when investors grow nervous about prospects for repayment. The size of that chance is not a matter of opinion. S&P’s record of sovereign ratings from 1975 to 2024 shows that a sovereign rated BB at the start of a year (the category that includes BB+) had a 10.1% probability of defaulting on its foreign-currency debt within ten years; for the speculative-grade group as a whole the figure was 23.5%.7 Bondholders in sovereign restructurings have typically lost between a third and a half of their claims.8 Taking the BB figure and a loss of half, a BB portfolio historically has lost about 5% of its value to default over a decade, or roughly 50 bps a year. That is the ordinary, expected cost of holding the asset, and it comes out of the spread. It explains only part of the spread, and it is not the whole of the cost. Table 8.2 below shows that since 2000 the index has returned 128 to 156 bps a year less than its spread promised, because the index also holds borrowers rated below BB, which default more often, and because bond prices fall when spreads widen. These are records of the past. They do not tell us what defaults or prices will be over the next decade, and the same caution applies to every historical figure in this chapter.
The premium for bad years
Beyond that expected loss, investors require additional compensation for uncertainty: the losses are not spread evenly across years but arrive in clusters, and a fund that must make fixed payments every year cannot treat a bad year as a rounding error. Emerging-market bonds fell by 29% between May and October 2008 and by 26% between September 2021 and October 2022.9 The spread pays for bearing that as well. Higher risk bonds are often less liquid, meaning that the trade in these bonds is thinner, so that it may be difficult to find a buyer without cutting the price.
No free money
If more of the spread were free money than this suggests, the largest investors in the world would already be taking it. In a competitive market, investors trying to make a profit will buy any asset that yields more than its risk justifies; their demand drives the price up until the price reflects the risk, leaving no excess profit available. Sovereign wealth funds, hedge funds, pension funds and insurers face no rule against appropriate diversification into emerging-market bonds, and most hold a small share of their bond portfolios in them. Norway’s Government Pension Fund Global, the largest sovereign wealth fund in the world, is permitted by its Ministry of Finance to hold up to 5% of its fixed-income investments in emerging markets. At the end of 2025 it held only 2.5% in emerging markets.10 The managers of this fund, with a horizon measured in generations, choose to hold only half of what it is allowed of the asset class the TFIF proposes should make up 90% of its portfolio.
The case for an uncompensated premium
There is a respectable argument that some part of the spread is nonetheless uncompensated. It has been argued that rating agencies rate some developing-country sovereigns, African ones in particular, lower than a model based on their economic fundamentals would; emerging-market bonds are less liquid than developed-market bonds, and some institutional investors are prevented by regulation from holding more of them.11 Each of these could leave a premium on the table for a patient investor. We do not dispute that such a premium may exist or at least may have existed in the past, when emerging-market bonds were a relatively new product. But the TFIF would be buying the same bonds, from the same dealers, at the same prices as the fund managers who already hold them, and $125 billion is a large sum to place in this market without moving the price against oneself. More important, whatever the source of the premium, collecting it means holding the bonds through the years in which their prices fall.
Holding till maturity
It may be objected that a fall in price does not matter to an investor who holds a bond until it matures: if the borrower does not default, the bond is repaid at par, whatever its price was in between. That is true of an investor who can wait. The TFIF cannot simply wait for maturity in all cases, since it is financed with borrowed money that falls due. Its own bonds mature and have to be refinanced, and there is no basis for assuming that its assets will mature on the same dates as its liabilities. If lenders will not refinance a fund whose assets have fallen in value, and no new investment is coming in, the fund has to sell assets at the prices of the day to repay the bonds that are due. The Note’s own rules work on the market value of the portfolio. For example, it says that the model “is vulnerable to market changes in the valuation of its asset portfolio,” and that payouts will be curtailed when senior liabilities exceed about 85% of assets (p. 73), so a fall in prices can stop Forest Payments whether or not any borrower has defaulted. That is, the value of the assets held in the portfolio is relevant to the ability of the fund to pay forests or equally to borrow new money. The Note suggests that the fund “will always have the option to sell assets to deleverage the structure” (p. 74), which is only relevant if the fund is not “waiting”. A fund that sells after prices have fallen makes the loss permanent. For a leveraged fund with dated liabilities a fall in prices is therefore a real cost. The question for the rest of this chapter is not whether there is a real spread between a risk-free asset such as US Treasuries and emerging-market bonds, but how much of that spread survives the costs of running the fund and the years in which the losses arrive.
8.3 The Facility’s arithmetic, tested
The Concept Note’s requirement has three parts: a gross spread over Treasuries, a cost of capital, and a running cost. Each can be checked against evidence. We take them in turn and then compute what is left.
8.3.1 The spread that was actually earned
Promised against earned
The TFFF Concept Note’s projection assumes that its portfolio will yield 350 bps over Treasuries. Its historical analysis uses the J.P. Morgan EMBI Global index as the benchmark, and that index is the natural place to check the assumption.12 The spread on an index is the extra yield its bonds promise over Treasuries if every bond pays in full. It is a promise, not a return. By construction it assumes that there will be no defaults, no restructurings and no fall in prices. What an investor actually earns over Treasuries is a different number, and it is the one that matters for a fund that has to pay its bills out of realised income.
Table 8.2 shows both the spread offered and the excess return. The spread is the average of the EMBI Global spread over each period.13 The excess return is the difference between the annualised total return on the EMBI Global index and the annualised total return on the Bloomberg US Treasury 7–10 Year index, which has a similar duration.14 The rows divide the record at 2008 and at 2020, the two crises of the period, and split the stretch between them at 2015, so we also show the entire period and the period since 2008. The total return includes every default and restructuring in the period, among them Argentina in 2001 and 2020, Ecuador in 2008 and 2020, Venezuela from 2017, Lebanon, Zambia and Suriname in 2020, Sri Lanka, Russia, Belarus and Ghana in 2022, and Ethiopia in 2023.
Table 8.2. Spread offered and excess return earned, EMBI Global over US Treasuries
| Period | Average spread, bps | Excess return earned over Treasuries, bps a year |
|---|---|---|
| 2000–2007 | 486 | 426 |
| 2008–2014 | 358 | 124 |
| 2015–2019 | 373 | 300 |
| 2020–2025 | 356 | 223 |
| 2000–2025 | 400 | 272 |
| 2008–2025 | 362 | 206 |
Source: Authors’ calculations from the J.P. Morgan EMBI Global stripped spread (Bloomberg JPEIGLSP Index), the J.P. Morgan EMBI Global total return index (Bloomberg JPEIGLBL Index) and the Bloomberg US Treasury 7–10 Year total return index (LT09TRUU Index), daily, January 2000 to August 2026. Returns are computed from year-end index values and annualised; the spread series ends in September 2025. See notes 13 to 15.
Where the difference goes
Over the whole period the spread averaged 400 bps, but the excess return was only 272. Since 2008 the spread has averaged 362, but the excess return 206.15 The difference between the two columns, 128 bps over the whole period and about 155 since 2008, is the cost of holding the asset: the defaults, the restructurings and the price changes that the spread promises away. Even in 2000–2007, when spreads fell from about 800 bps in early 2000 to a low of about 150 in mid-2007 and bondholders collected a large capital gain on top of their coupons, the return fell short of the spread by 60 bps a year. Spreads cannot fall by 500 bps from where they are now. In every period the return has fallen short of the spread, by between 60 and 234 bps a year.
The two periods used
We use two of these periods in what follows, as contrasting examples. The full period, 2000–2025, begins with spreads above 700 bps and includes the gain bondholders made as spreads fell; its excess return is 272 bps. The period 2008–2025 leaves that gain out and begins just before the fall of 2008; its excess return is 206 bps. These are two examples of what the future could hold, not promises. A different starting year would give a different figure.
No safe basis for forty years
None of these figures is a safe basis for a forty-year projection. The Concept Note’s own analysis covers only “the past 20 years.”16 The index fell by 29% in 2008 and by 26% in 2021–22. Forty years is long enough for both to happen again and for something worse to happen once. A fall of either size on the 90% of the portfolio held in emerging-market bonds is larger than the 20% cushion under the fund’s senior bonds. If those bonds carried covenants tied to the market value of the portfolio, a fall of this size would put the TFIF at risk of being closed. Section 8.4 returns to this.
8.3.2 The cost of borrowing
The Secured Option, because sponsors lend
The Concept Note puts the TFIF’s weighted average cost of capital at 72 to 140 bps over Treasuries. The figure applies to the whole $125 billion.17 The low end of the range is not available on the terms sponsors have offered. The 72 bps figure belongs to what the Note calls the “Unsecured Option” for issuing senior bonds, and that option requires that “a minimum of 2/3 of capital needs to be paid in equity.”18 The Note continues: “If the majority of junior sponsor capital (over 2/3) will not be provided in the form of paid in equity, then the Secured Option represents the most viable way forward.”19 The sponsor commitments made so far are mostly loans. The United Kingdom’s £400 million is a loan, and Norway’s $3 billion, the largest pledge, is a loan to be disbursed to 2035 and repaid by 2075. Brazil and Indonesia have each committed $1 billion, described as investments, without saying publicly whether as loans or equity.20 Germany has committed EUR1 billion in what appears to be equity, but as of September 2026 it is uncertain whether that commitment will hold.21 Even if Brazil’s and Indonesia’s money were equity, equity would be only about one third of the $10 billion required to start up the fund, the minimum on which Norway has made its own loan conditional, not two thirds. The Facility is therefore on the Secured Option, at the upper end of its own range. We use 120 bps as the central case and 140 as the upper boundary. Since sponsor capital receives the Treasury rate, a weighted average of 120 bps on $125 billion implies that the fund must be paying 150 bps on the $100 billion of senior bonds; similarly 140 bps implies that the cost of market borrowing is 175 bps over US Treasuries.22
Why 150 bps or more
It should not be surprising that investors would require a spread of 150 bps or more over Treasuries to hold the TFIF’s senior bonds. First, the bonds are claims on a portfolio that is 90% emerging-market debt with an average rating of BB+, protected by a cushion of $25 billion. (The Note provides for a buffer of liquid assets of about 10%, p. 74, and bases its projection on a BB+ portfolio of emerging-market bonds only, p. 41.) Losses beyond 20% of the portfolio fall on the senior bonds. The index fell by 29% in 2008 and by 26% in 2021–22, so a senior investor is buying exposure to the same defaults and price falls described in Section 8.2, one layer removed. Second, the portfolio would be actively managed. An investor who buys an index fund knows what he holds; an investor who buys the TFIF’s bonds knows the investment guidelines, and has to trust that the composition, the credit quality and the leverage will not drift over the years the bond is outstanding. The manager has a reason to let them drift: the Forest Payments have to be found in the portfolio’s returns, and the Note allows that the Board “may consider other investment assets based on return prospects and risk to sponsor capital” (p. 38). The Secured Option narrows this without removing it. Under the Secured Option each series of bonds is backed by its own compartment of assets and carries its own rating, so the investor can see what secures his bond and the manager’s discretion is confined to the rules of that compartment. But the compartment is still a managed portfolio, whose eligibility rules and coverage tests the investor has to monitor, and the structure that gives him this protection has to be set up, rated series by series, and administered for as long as the bonds are outstanding. The Note says as much: the Secured Option is “a more complicated and costly structure to set up and administer over time.”23 Discretion has a price; where the structure limits it, part of that price moves from the coupon to the running cost, which is taken up in Section 8.3.3. Third, the TFIF would be a new issuer with no record. There is no established market for its bonds, no history of how they trade under stress, and no assurance that an investor who needs to sell in a bad year will find a buyer without cutting the price. Investors charge for that uncertainty as well. The Concept Note itself says that “it is difficult to estimate where the market rate for TFIF’s senior debt will be at the time of issuance.”24
8.3.3 The cost of running the fund
The Concept Note's 15 to 25 bps
The Concept Note expects the TFIF’s expenses to be “in the 15-25 bps range (also referenced to the entire USD 125 billion asset base).” These expenses are to cover “the TFIF CFO, CIO and staff, the TFFF Secretariat, the operations of the Trustee of the TFFF, the Boards of Directors of the Facility and the TFIF, and the securing of a range of services the TFIF will require from the Treasury Manager, Asset Managers engaged to manage the TFIF portfolio, risk monitoring by experienced experts and other service providers.”25 The Note attaches the lower figure to the Unsecured Option, whose administrative cost it puts at 7 bps plus 16 bps of negative carry on the liquidity it must hold, and the upper figure to the Secured Option.
Twenty-five bps as a floor
Fifteen basis points is not a realistic figure for a fund of this kind. We assume 25 bps, the top of the Note’s range, for three reasons. First, the TFIF would issue its own bonds and pay underwriting fees on each issue. At 150 bps over Treasuries, the central case in Section 8.3.2, its senior bonds would be priced like those of a BBB-rated issuer, and underwriting fees on BBB-rated bond issues average about 0.45% of the amount raised.26 On $100 billion of eight-year bonds that is $450 million for every issue, or between 4 and 5 bps a year on the fund once it is spread over the life of the bonds, and the fees recur each time the bonds are refinanced.
Second, the portfolio would be actively managed, not indexed. The Facility’s own call for service providers, issued in July 2026, describes a permanent fund manager delegating portfolio management “to one or more portfolio managers under segregated mandates across investment sleeves,” with a separate depositary, central administrator and banking provider.27 Each of those is paid. For comparison, the largest fund tracking the emerging-market index, the iShares J.P. Morgan USD Emerging Markets Bond ETF, charges 39 bps a year on $14.4 billion of assets with no active management at all, though a mandate of the TFIF’s size would pay less; the equivalent index fund for US Treasuries charges 15.28 Active management of a portfolio of $125 billion mostly invested in one asset class would be challenging and would certainly be costly.
Third, the TFIF is a multinational institution answerable to dozens of sponsor and forest-country governments, with the boards, reporting and compliance that implies, and it would likely need to obtain and keep a credit rating, since most institutions only buy rated bonds; under the Secured Option, which is where the sponsors’ loans put it, it would need a rating for each series of bonds and a separate issuing entity, with its compartments, to administer. The administrative costs of dealing with many different countries and institutions should not be discounted.
Concept Note 3.0’s own example implied 28 bps of costs: $3.75 billion of spread less the $3.4 billion it said would be available.29 Twenty-five bps is therefore a floor rather than a central estimate, and it covers the fund alone. The Facility itself, the secretariat, boards and verification apparatus that decide who is paid and how much, is an additional cost. We estimate this cost in Chapter 10 at $60 to $95 million a year. We take the lower figure, which is about 5 bps on the fund, so the administrative cost used in the remainder of this section is 30 bps: 25 bps for the fund and 5 bps for the Facility.
8.3.4 What is left
The fund would not have earned $2 billion a year
Table 8.3 subtracts the cost of capital and the running cost from the spread. The two rows use the excess returns actually earned over Treasuries in Table 8.2, for 2000–2025 and for 2008–2025. The fund would hold a tenth of its assets in Treasuries, which earn no spread, so the gross spread on the fund is nine tenths of the excess return on emerging-market bonds. The two columns of results are the central case and the upper boundary for the cost of capital; both use 30 bps for the cost of running the fund and the Facility. The Note’s requirement for $2 billion is 160 bps net of the cost of capital and expenses; the requirement for $4 billion is 320.
Table 8.3. Net spread available for Forest Payments, bps on $125 billion
| Excess return on emerging-market bonds | Gross spread on the fund | Cost of capital 120bp, expenses 30bp | Cost of capital 140bp, expenses 30bp |
|---|---|---|---|
| 272bp (earned, 2000–2025) | 245bp | 95bp = $1.19bn | 75bp = $0.94bn |
| 206bp (earned, 2008–2025) | 185bp | 35bp = $0.44bn | 15bp = $0.19bn |
Source: Authors’ calculations. Excess returns are from Table 8.2; the gross spread on the fund is nine tenths of the excess return, because a tenth of the fund is held in Treasuries; cost of capital and expenses are from Sections 8.3.2 and 8.3.3. All figures are before repayment of sponsor capital or retained capital, and are net of the defaults that occurred in the period but make no allowance for future defaults.
No entry in the table reaches $2 billion, and none comes close to $4 billion. The most favourable case, the full period from 2000 with the central cost of capital, gives $1.2 billion, and that period includes the one-off gain of 2000–2007. Using returns from the period since 2008 the fund would have generated between $0.19 and $0.44 billion a year for the forests, a small fraction of the target. The two columns differ by 20 bps, the difference between a cost of capital of 120 bps and one of 140. That is worth $250 million a year; notably the upper one is taken from the Concept Note’s range of borrowing costs.
A bar higher than 160
The Note’s requirement of 160 bps is itself incomplete. As Section 8.1 set out, it covers only the starting payment of $2 billion, and the payment the design implies once deforestation slows is nearer $4 billion. Beyond that, the Note says that the fund will retain part of its income so that it can repay the $25 billion of sponsor capital over forty years and hold its own equity in its place. Spread over forty years that is $625 million a year, or 50 bps on the fund, which would have to be earned on top of the 160 bps. Nor do the 160 bps allow for the adjustment for inflation, of up to 2% a year, by which the per-hectare payment is to rise. The Note caps that adjustment at 2% a year (p. 9), so when prices rise faster, as they did in the United States in every year from 2021 to 2025, the difference falls on the forest countries. On a full accounting the bar is higher than 160 by at least 50 bps.
From averages to years
Table 8.3 treats the spread as if it arrived evenly, every year, on a fund that was fully invested from the first day. Neither of these assumptions resembles the situation in which the fund would operate. Emerging-market returns come in runs of good years broken by a year in which a quarter of the portfolio’s value disappears, and the fund would be built up over several years and financed with borrowed money that has to be refinanced. Section 8.4 takes up these points by running the fund through the years as they happened.
8.4 The TFIF run through the markets of 2000 to 2026
Nineteen launches, day by day
Section 8.3 worked with averages, but the fund must operate in years with good and bad performance. This is important since four fifths of the fund’s money is borrowed from market investors with bonds that must be refinanced as they mature. A fund of that kind is tested in the bad years. When the value of its portfolio falls, can it still refinance its bonds, pay its sponsors and pay the forests, and how long does it take to recover? The answer depends on the fund’s rules and on the order in which the good and bad years arrive. This section takes the investment strategy the Concept Note describes, with its own rules for borrowing, refinancing and paying out, and asks how it would have fared had it been put in place at some point in the past. The usual caveat applies: what happened between 2000 and 2026 does not tell us what will happen between 2026 and 2052. But a fund that would have fallen short of its promises for every year it could have been launched carries a burden of explanation.
This section builds the TFIF as the Concept Note describes it and runs simulations of it, day by day, through the emerging-market and Treasury markets as they actually behaved from 2000 to August 2026. In our simulations, the fund is launched on the first trading day of each year from 2000 to 2018, so there are nineteen runs. Each is one possible history of a single fund, so we report the range across the nineteen and the number that pass or fail. Prices and interest rates are drawn from the actual data of each day.30 The model is set out in full in Appendix 8A. What follows here is a summary.
The build-up and the five rules
The fund is built up over eight years, with sponsor money and market borrowing arriving daily in the ratio 1:4 until $25 billion and $100 billion have been raised.31 It invests 90% in the EMBI Global index and 10% in Treasuries. It borrows by issuing eight-year bonds at the Treasury yield plus 150 bps, which is 120 bps on the whole fund, the central case in Section 8.3.2, and it pays its sponsors the Treasury yield. It pays a management fee of 20 bps a year and an underwriting fee of 0.45% on every bond it issues, about 25 bps a year together, and $60 million a year for the running of the Facility. The eight-year build-up and the eight-year life of the bonds are our assumptions to enable us to model a “steady state,” and are close to the 10-year investment plan of sponsor countries such as Norway. The Note’s own model has the sponsors’ money arriving at the start, and it gives no maturity for the bonds beyond “5+ years” (p. 74).
We apply five rules, all taken from the Note, to govern what the fund pays out. When a bond issued by the fund matures, the fund automatically issues a new bond of an equal amount to raise the money to repay it, provided that the fund’s assets are at least 125% of its bonds; otherwise the bond is repaid out of assets and the fund shrinks. The sponsors’ coupon is paid each year only if assets would still cover the bonds afterwards, and what cannot be paid is cancelled.32 The Forest Payment is made at the end of each year and is capped at the amount that leaves the bonds at or below 85% of assets.33 The scheduled payment is drawn from the Note’s own cash-flow projection: nothing in the first year, $2.2 billion in the fourth and $4.0 billion in the twenty-third. A shortfall is carried forward and paid when the cap allows.34 From the tenth year, if everything else has been paid in full and assets are at least 125% of bonds, then the fund repays up to one thirtieth of the sponsors’ capital. When the same conditions are met it may also sell new bonds, up to the point where its assets are 125% of its bonds, either to replace bonds it was earlier forced to repay or to grow. The Note’s projection shows the fund growing but does not say when it may borrow again, so this condition is our assumption.35
What is left out, and the bondholders' patience
In numerous ways, these simulations are generous to the fund. The model does not charge the fund anything for selling bonds in a falling market, does not raise the fund’s own borrowing cost as its cushion thins, and does not model a rating downgrade or the loss of market access that would follow one. Each of these would make the results worse.
The model also assumes that the bondholders wait. It lets the fund carry on when its assets have fallen below its bonds, keep paying coupons, and repay each bond at par as it matures. Whether the fund’s bonds would allow this is not known, because their terms have not been published. Lenders to a fund that holds traded bonds with borrowed money usually have some protection against a fall in the value of the portfolio. IFFIm, the nearest existing precedent, has one: its bonds are in default if its debts exceed the value of its assets for 150 days. In the simulations the breaches of October 2008 and March 2020 last a few days. Those of 2022 do not: in fifteen of the nineteen launches assets stay below bonds for more than 150 days. The results that follow assume that the bondholders have no right to declare the fund in default of its covenants. Appendix 8A.7 sets out the evidence.
Three remedies that cannot be counted on
The Note relies on three things that might be thought to improve the results. First, hedging interest-rate risk would have protected the fund when Treasury yields rose in 2022. It would also have taken away the gain the fund made while yields fell between 2000 and 2020, it would have required large cash payments in 2008, and it has a cost of its own (Appendix 8A.8). It gives no protection against the widening of credit spreads, and protection against that costs roughly the spread itself.
Ideally, the fund could also benefit from wise asset management. In our simulations, we simply use an index, i.e., what happened on average. If the fund were able to hire managers who invested more successfully than the market, that would help. Unfortunately, there is no evidence that it is easy to succeed by choosing a better manager. S&P’s scorecard of active fund managers finds that 85% of actively managed emerging-market debt funds in the United States underperformed their benchmark over ten years, and every one of them over fifteen, after fees.36
Finally, the Concept Note suggests that the fund could temporarily shift its assets into developed-market bonds in a crisis (p. 74). Unfortunately, unless the fund managers possessed a crystal ball, such a reallocation would be made after prices had fallen, and a fund that sold in October 2008 or March 2020 would have missed the recoveries that followed.
Table 8.4. The TFIF launched on the first trading day of each year, 2000–2018, run to August 2026, $ billion
| Launched | Public capital left | Payments to Forests | Average Payments to Forests | Per hectare per year ($) | G&A | Average G&A | Net |
|---|---|---|---|---|---|---|---|
| 2000 | 17.6 | 57.2 | 2.20 | 3.01 | 10.1 | 0.39 | +49.8 |
| 2001 | 24.0 | 54.1 | 2.17 | 3.03 | 10.9 | 0.44 | +53.2 |
| 2002 | 23.4 | 50.5 | 2.10 | 3.00 | 10.6 | 0.44 | +49.0 |
| 2003 | 11.7 | 45.0 | 1.96 | 2.85 | 7.9 | 0.34 | +31.6 |
| 2004 | 6.9 | 40.9 | 1.86 | 2.76 | 6.6 | 0.30 | +22.8 |
| 2005 | 3.5 | 37.8 | 1.80 | 2.73 | 5.4 | 0.26 | +16.3 |
| 2006 | 0.0 | 33.7 | 1.69 | 2.62 | 4.3 | 0.22 | +8.7 |
| 2007 | 0.8 | 31.1 | 1.64 | 2.60 | 4.2 | 0.22 | +6.9 |
| 2008 | 1.2 | 30.4 | 1.69 | 2.74 | 4.3 | 0.24 | +6.6 |
| 2009 | 0.8 | 26.9 | 1.58 | 2.63 | 3.9 | 0.23 | +2.6 |
| 2010 | 0.1 | 22.2 | 1.39 | 2.36 | 3.3 | 0.21 | −2.8 |
| 2011 | 0.8 | 19.4 | 1.29 | 2.26 | 3.1 | 0.21 | −4.9 |
| 2012 | 1.2 | 16.6 | 1.19 | 2.14 | 2.8 | 0.20 | −7.2 |
| 2013 | 1.9 | 14.0 | 1.08 | 2.00 | 2.7 | 0.20 | −9.0 |
| 2014 | 2.2 | 12.3 | 1.03 | 1.96 | 2.5 | 0.20 | −10.4 |
| 2015 | 5.9 | 10.8 | 0.98 | 1.95 | 2.2 | 0.20 | −8.3 |
| 2016 | 7.9 | 10.4 | 1.04 | 2.16 | 2.0 | 0.20 | −6.6 |
| 2017 | 9.6 | 10.5 | 1.16 | 2.52 | 1.8 | 0.20 | −5.0 |
| 2018 | 11.6 | 10.4 | 1.30 | 2.98 | 1.6 | 0.20 | −2.9 |
Source: Authors’ simulation; the model and the definition of each column are in Appendix 8A. Figures are in nominal dollars, in billions except the per-hectare column. Public capital left is what remains of the sponsors’ $25 billion in August 2026, including capital repaid to them. G&A is fees and the running cost of the Facility. Net is Payments to Forests less the public capital lost. The launches from 2013 onward have run for only eight to thirteen years, so the rise in capital left in the last rows reflects the data ending in August 2026, not better performance.
The early launches do best
Table 8.4 summarises the results of the simulations, year by year. Results differ a great deal by launch year, and the early launches do very well. The funds launched in 2000, 2001 and 2002 pay forest countries $50 to $57 billion over twenty-four to twenty-six years, and in August 2026 their sponsors still have $18 to $24 billion of their $25 billion. They would have to be considered successes, at least in terms of the total amounts paid although not in their consistency or durability. Later launches do worse on both counts, though the launches from 2013 on have had only a few years to run.
No launch pays the schedule
No launch pays what the schedule promises. Across the nineteen launches the share of scheduled Forest Payments actually made, catch-up payments included, runs from 49 to 76%, with a median of 65%. Table 8.4 expresses this per hectare: against the $4 promised, the forests receive between $1.95 and $3.03. Sixteen launches deliver at least half of the schedule and eight at least two thirds. Nothing is due in the first year of a launch. In the other 304 fund-years of the nineteen runs the scheduled payment is made in full in 156, or 51%; in part in 34, or 11%; and not at all in 114, or 38%. The missed years come together. The 2010 launch pays nothing for the five years from 2021 to 2025. Catch-up payments make up a good part of the shortfall when markets recover, but every launch is in arrears in August 2026, by between $4 and $19 billion. The Note describes curtailment as something that “should only occur in the case of a structural widening of all credit spreads due to a global liquidity event. Such events do occur, but are temporary.”37 In our simulations, no payment at all is made in nearly two years out of five.
Sponsor capital impaired in every launch
Sponsor capital is impaired in every launch. The second column of Table 8.4 shows what is left of the sponsors’ $25 billion in August 2026, counting what has been repaid to them. No launch has it intact. The three earliest have $18 to $24 billion; the 2003 launch has $11.7 billion and the 2004 launch $6.9 billion; every launch from 2005 to 2014 has less than $4 billion, and sponsor investment from the 2006 launch is completely lost by 2026. Sixteen of the nineteen have lost more than half. Sponsors are repaid something in five launches. Those of 2000, 2001 and 2002 repay $3.3, $4.2 and $3.3 billion, in installments of $0.83 billion between 2011 and 2021, and those of 2003 and 2005 make a single repayment each. In the other fourteen the sponsors have not been repaid a dollar by August 2026. The fund also borrows beyond its original programme, in the six launches from 2000 to 2005, and on a large scale. At the settlement of January 2013, after the strong returns of 2012, each of these six funds borrows between $44 and $80 billion, and the 2001 and 2002 launches reach about $240 billion of bonds. The emerging-market sell-off of 2013 began a few months later.38 Repayment and new borrowing happen only in years when it is the schedule, and not the gearing limit, that has capped the Forest Payment: the payment rule pays out until the bonds are 85% of assets, which is 118% cover, and the repayment and borrowing rules need 125%.
Retained earnings that do not last
The Note expects the fund to build retained earnings in place of the sponsor capital. In the simulations it does so only for short periods. When the fund earns more than the scheduled payment and any arrears, the surplus is kept, and the fund then borrows against it, as the Note’s chart has it doing, until its bonds are back at 80% of its assets. The 2003 launch had retained earnings of $21 billion in January 2013, and a year later they were gone. In August 2026 retained earnings are negative in every one of the nineteen launches, which is to say that part of the sponsors’ capital has been lost, and in the 2006 launch the fund owes its bondholders more than it holds. A fund that stays in that position would be in default under a covenant like the one IFFIm’s bonds carry.
A fund that shrinks
The fund does not hold its size, which is a separate matter from the loss. When the cushion under the bonds thins, the refinancing test fails, and maturing bonds are repaid to market investors instead of being rolled over. That is not a loss. It is the fund giving back borrowed money. But a smaller fund is less able to earn anything for the forests. In fourteen of the nineteen launches the bonds outstanding in August 2026 are less than half of what they were at their peak, and the eight launches from 2005 to 2012 each hold less than $25 billion of bonds, against a programme of $100 billion.39 By August 2026 not one of the previous simulated launches has the 125% cover it would need to refinance a bond, and every launch is far behind on its payments to forest countries. The reasonable expectation is that each of these funds, short of a run of exceptional years, goes on repaying its bonds as they mature and shrinks, with less to pay the forests each year. Whether it ends in default depends on markets after 2026, which the record cannot show. “Forever” is in the Facility’s name, but it does not describe the fund that is meant to pay for it.
The Note's Monte Carlo against the record
The Note’s own risk assessment, a Monte Carlo simulation, gives “a 10.6% chance of a coupon skip and a 1.1% chance of a capital impairment” on its most conservative portfolio.40 Our analysis is not far from this in terms of coupons: we find that the coupon is short in 11% of fund-years across the simulations, all of them between 2022 and 2025. However, our assessment of the capital impairment is much more negative. Sponsor capital is impaired in August 2026 in every one of the nineteen launches, and more than half of it is gone in sixteen, leading to unavoidable contraction of the fund. The Note does not say whether its probabilities are for a single year or for the life of the fund. Concept Note 3.0 reported two further results of the same exercise, which Concept Note 3.1 leaves out, and stated the first of them for the life of the fund: a 60% probability that a Forest Payment would have to be reduced at some point, and an expected payout of about 98% of the amount due. Also gone from 3.1 are the illustrative BBB- portfolio priced at 250 bps over Treasuries, the distribution of portfolio outcomes in its Figure 8 and the AAA leverage limit; the Facility’s Financial Q&A of 23 October 2025 says the figure “is no longer useful since TFIF has already been assessed by external credit ratings”. In our simulations the forests receive between 49 and 76%. The Note also reports that over twenty years there were only 216 days on which its unlevered portfolio traded below 85% of par, and concludes that “it is only during the Global Financial Crisis of 2008/9 that there would have been a TFIF Investor and Sponsor coupon disruption.”41 That is a fair description of a portfolio that keeps its income and preserves its cushion. The TFIF pays out much of its income to the forests and eats up its sponsor capital. In our simulations the assets of the 2006 and 2010 launches are worth less than their bonds on about a quarter of days, for reasons set out in Appendix 8A.
The 2010 launch
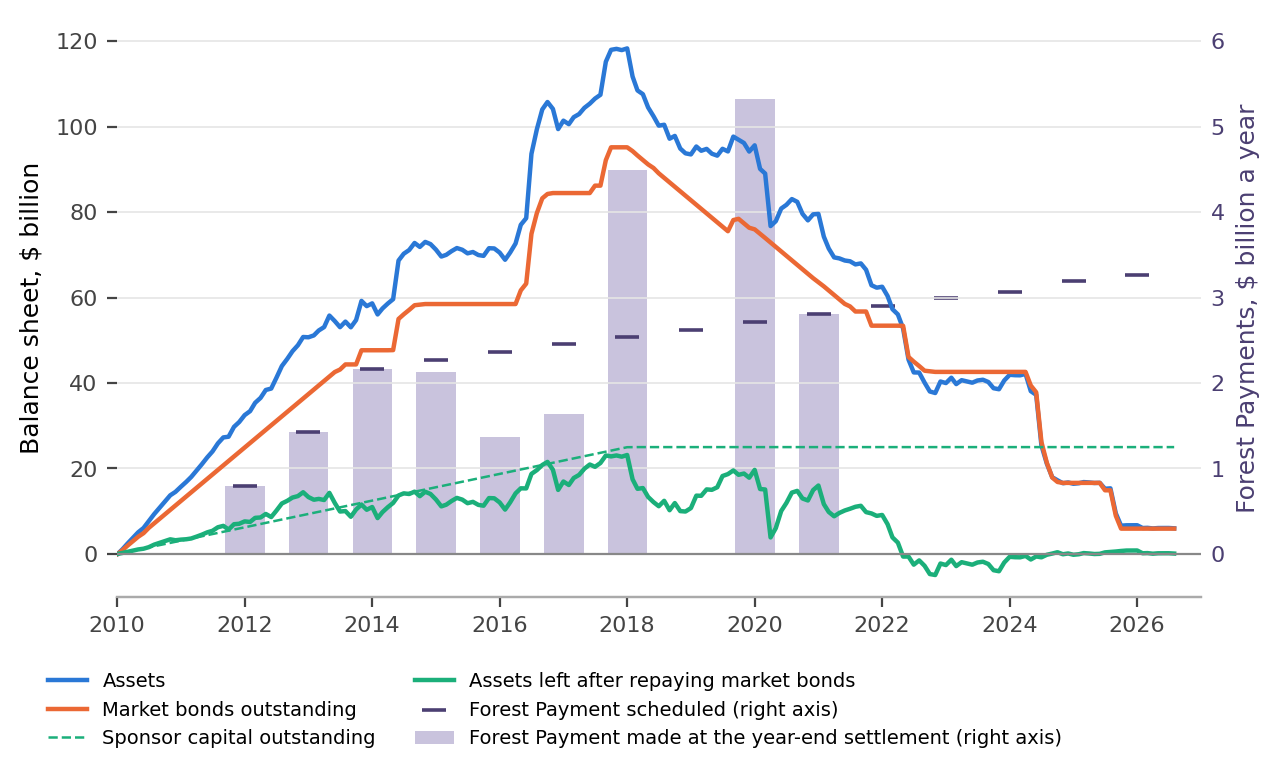
Figure 8.1 shows the 2010 launch. The lines, read against the left-hand axis, are its assets, its bonds, and what would be left for the sponsors if the bonds were repaid. The bars, read against the right-hand axis, are the Forest Payments made, and the short dashes are the payments scheduled. In this simulation, the fund paid on schedule for 2011, 2012 and 2013. After the sell-off of 2013 the gearing limit cut its payments for three years, and in 2015 the refinancing test stopped it borrowing. It made up the arrears with its payment for 2017, paid nothing for 2018, made up the arrears again for 2019 and paid 2020 in full. It was at its largest in September 2017, with $119 billion of assets, and it never reached $125 billion. Starting in 2018 its bonds began to fall due. Since its assets were less than 125% of its bonds, all but $1 billion of the bonds could not be refinanced, and the fund repaid them out of assets and shrank. It has paid the forests nothing since the payment for 2020, and its assets were below its bonds from April 2022 to August 2024. In August 2026 it would have held $6.0 billion of assets against $5.9 billion of bonds, with $0.1 billion left of the sponsors’ $25 billion and arrears of $15 billion owed to forest countries. Appendix 8A gives the account year by year.42
Forests paid against public capital lost
The last column of Table 8.4 sets what the forests received against what the public lost. It is Payments to Forests less the sponsor capital lost, in nominal dollars, and it leaves out the interest the sponsors were paid. It is positive in the ten launches from 2000 to 2009 and negative in the nine from 2010 on. The 2001 launch paid the forests $54.1 billion and lost $1.0 billion of its sponsors’ capital. The 2014 launch paid $12.3 billion and lost $22.8 billion. In the good launches the fund simply earned more on emerging-market debt than it paid on its bonds. This is what one might expect: if an investor takes a position in a market, sometimes it will pay off, and sometimes not. The later launches have had fewer years in operation, but more than half of their capital is already gone.
Who is paid
The simulations also show who is paid. In the 2010 launch the fund paid its bondholders $27 billion in interest over sixteen years and its sponsors $5 billion in interest, and paid the banks and managers that underwrote its bonds and ran its portfolio $2.3 billion in fees, against $22 billion to the forests.43 That is the arithmetic of borrowing to invest: the largest share of what the portfolio earns is owed to the lenders. The underwriting fee is earned when the bond is sold and the management fee accrues every day. With the Facility’s own budget they make up the G&A columns of Table 8.4: $0.2 to $0.4 billion a year in every launch, whatever the forests received.
The design behind the results
It is important to understand that the simulation results are not a matter of bad luck in particular years. Anyone who borrows to invest in an asset class faces the ordinary problem of investing: some years make money and some lose it. If the asset generates normal returns, then the investment will grow along with it. The TFIF, unfortunately, is not designed to grow along with the market. First, it pays a substantial premium over Treasuries to borrow, which reduces the potential gains. Second, it has to pay fees to its managers and underwriters. And third, it does not keep what it earns in good years. The surplus goes to the forests, and what is left is borrowed against, so that the fund seldom goes into a downturn with much more than the cushion it started with. A fund built that way has little to absorb the next fall, and the falls of 2008 and 2022 were larger than the cushion. That is what Table 8.4 shows, launch after launch. It follows from the design and not from the accidents of the period, though a different period would give different numbers.
A good decade is evidence about that decade
The simulations above use the realised returns on the asset classes the Concept Note specifies. Past performance, as every investment prospectus notes, is not indicative of future results, and the TFIF proposal is a pointed example of this warning. Kenneth Lay first described a fund that would pay for forests out of investment returns at Copenhagen in December 2009, as discussed in Chapter 5. A test of the present design on the record available at that date would have been encouraging. However, a good decade is evidence about that decade. In the early 2000s emerging-market bonds were still a young asset class, and much of what they earned came from a single repricing, as the spread fell from about 800 bps in early 2000 to about 150bps in mid-2007. That gain could not be repeated once the asset class was established and widely held.44
8.5 The spread available in 2026
From the record to the present
Sections 8.3 and 8.4 examined the historical evidence on the investment strategy: what emerging-market bonds have paid over Treasuries since 2000, and how the fund would have fared had it been launched in any year from 2000 to 2018. This section turns from the record to the present. It asks what the fund could expect to earn for the forests if it were launched at the spreads available in mid-2026.
The Concept Note’s projection assumes a gross spread of 350 bps over Treasuries.45 Concept Note 3.0’s worked example used a portfolio yield of 8.3%, the EMBI spread plus the long-term Treasury yield on a single day in 2024, when the index spread was about 340 bps.46 Neither figure describes the market of 2026.
Two measures of today's spread
Two measures of the spread are available. The first is the yield gap between the two largest funds tracking the relevant indices. On 4 September 2026 the iShares J.P. Morgan USD Emerging Markets Bond ETF, which tracks the diversified core of the EMBI Global, reported an average yield to maturity of 6.45%; the iShares 7–10 Year Treasury Bond ETF, of similar duration, reported 4.73%.47 The gap was 172 bps. The second is the stripped spread of the EMBI Global Diversified index, which fund managers publish in their monthly commentaries: 235 bps at the end of August 2026, after 244 at the end of July and 289 at the end of March.48 The two measures of spread capture different investment portfolios, but the higher one is used below to give the fund the benefit of the doubt. Both are below the 247 bps floor of the Note’s own required range. Since 2000 the EMBI Global spread has been below that floor on 8% of days, almost all of them in 2005, 2006 and 2007; its average over the period was 400.49 The managers’ commentaries describe the spreads of early 2026 as “multi-year lows” and “historically tight.”50
Table 8.5. Net spread available for Forest Payments on the spreads of 2026, bps on $125 billion
| Spread on emerging-market bonds | Gross spread on the fund | Cost of capital 120bp, expenses 30bp | Cost of capital 140bp, expenses 30bp |
|---|---|---|---|
| 235bp (index spread, August 2026) | 212bp | 62bp = $0.78bn | 42bp = $0.53bn |
| 172bp (yield gap, September 2026) | 155bp | 5bp = $0.06bn | −15bp = −$0.19bn |
Source: Authors’ calculations. The August 2026 index spread is the J.P. Morgan EMBI Global Diversified stripped spread as reported by State Street Investment Management; the September 2026 yield gap is the difference between the average yields to maturity of the iShares EMB and IEF funds; the gross spread on the fund is nine tenths of each measure, because a tenth of the fund is held in Treasuries; cost of capital and expenses are from Sections 8.3.2 and 8.3.3. Both rows are before any allowance for defaults, repayment of sponsor capital or retained capital.
What is left at 235 bps
Table 8.5 shows the potential earnings given the spread available in mid-2026. As in Table 8.3, the fund earns the spread on nine tenths of its assets, so an index spread of 235 bps is 212 bps on the fund. After subtracting 120 for the cost of capital and 30 for running the fund and the Facility, 62 bps are left, or $0.78 billion a year on $125 billion. If we apply the yield gap derived from the two ETFs, the residual after costs is only 5 bps, or about $60 million a year. On the higher measure the fund would cover between a quarter and two fifths of its starting payment, and an eighth to a fifth of its target. On the lower measure it would cover about 3% of the starting payment at best.
Before defaults
These figures do not account for any defaults. The spread is a promise, as Section 8.2 set out, and Table 8.2 shows that the promise exceeded what was collected by 128 bps a year over 2000–2025 and by 156 since 2008. If we deduct the 50 bps a year that Section 8.2 derived from the rating agencies’ default and recovery rates, the amount of cash generated by the fund would be trivial or negative. And none of the figures allows for the 50 bps a year needed to repay sponsor capital or for the 2% inflation escalator by which Forest Payments are supposed to rise.
The spread as a price
The opportunity for the fund’s investment strategy to earn large profits seems not to be present. On one hand, the spread is too thin right now to generate high profits. And the opportunity for the spread to fall further is constrained: it is already low. But this presents a problem, since if the spread were to increase, the value of assets in the portfolio would fall, and the gearing ratio would work against the fund. The launches in Section 8.4 that did best, those of 2000 to 2003, began buying when the spread was between 650 and 820 bps; they collected a high income and gained as spreads fell. A fund launched in 2026 would buy at the other end of the range.
The section in dollars
To put the section in dollars: the Facility promises forest countries $2 billion a year to begin with and $4 billion a year once the eligible forest is fully enrolled. On the market of mid-2026, after the cost of borrowing and the cost of running the fund and the Facility, a $125 billion TFIF would have at most $0.8 billion a year for the forests, and that is on the wider of the two spread measures, the central cost of capital, and no allowance for any borrower ever failing to pay. On the lower measure of the spread, the 172 bps gap between the yield of the largest emerging-market bond fund and that of the Treasury fund, it would generate less than $100 million before any allowance for defaults. On the 500 million hectares the Note expects to qualify at launch, the range runs from nothing to about $1.55 a hectare, against the $4 promised. None of this depends on the simulations of Section 8.4; it is the Note’s own arithmetic with the prices of 2026 in place of its assumptions, and it is for a fund that already holds its full $125 billion.
8.6 Conclusion
The first question: how much
This chapter asked how much the TFIF can be expected to transfer to the Facility in a typical year, and how reliably. The answers are in Tables 8.3, 8.4 and 8.5.
On the first question, the Concept Note expects the fund to pay $2 billion a year to begin with, and its design implies $4 billion once deforestation slows. On the returns that emerging-market bonds have earned over Treasuries since 2008, and after the cost of borrowing and of running the fund and the Facility, the fund would have had $0.2 to $0.4 billion a year for the forests: a tenth to a fifth of the starting payment. Only by counting the years 2000 to 2007, when a fall in spreads gave bondholders a large one-off gain, does the figure reach $0.9 to $1.2 billion, and it still falls well short of $2 billion. On the spreads available in 2026 the fund would have between nothing and $0.8 billion a year.
The second question: how reliably
On the second question, a fund built and run as the Note describes, with the Note’s own schedule of payments, launched in any year from 2000 to 2018 and carried through the markets that followed, paid forest countries between 49 and 76% of what was scheduled. Where a payment was due, it was made in full in about half of the years and not at all in nearly two years out of five. Sponsor capital was impaired in every launch. Sixteen of the nineteen had lost more than half of their $25 billion by August 2026, and one had lost all of it. The early launches came closest to what the Note describes: those of 2000 to 2002 paid about three quarters of the schedule and kept $18 to $24 billion of their sponsors’ capital. Measured as money paid to the forests against public capital lost, the ten launches to 2009 came out ahead and the nine since came out behind. But the record contains no launch in which the fund did what the Note says it will do. The size of the fund is a separate matter from these losses. Rather than growing steadily, as the Concept Note’s chart shows, the fund grew in bursts and then shrank as bonds that could not be refinanced were repaid, and in fourteen launches it held less than half of its peak borrowing in August 2026.
A different portfolio, the same arithmetic
The Facility’s designers may answer that the portfolio could be changed: less emerging-market debt, more equities, property, infrastructure or private credit, or some mixture that has done better over the last twenty years. A portfolio that is 90% one asset class is unusually exposed, and a broader one would be less so. But the alternative does not escape the arithmetic. Any asset that pays more than Treasuries does so because it can lose value, and at four dollars of borrowing for every dollar of capital a fall of 20% in whatever the fund holds consumes the whole cushion; global equities fell by half in 2008–09, and listed property by two thirds.51 The fees are paid every year whatever the fund holds, and so is the premium on the bonds. Above all, the rules are the same: what the fund earns in a good year goes to the forests or is borrowed against, so it meets the next fall with little more than the cushion it started with, and the only way to hold a larger one is to pay the forests less or to borrow less. The reasoning applies to any portfolio, and it suggests that the results in Table 8.4 come from the design more than from the asset class.
Set by the launch year
The other lesson of Table 8.4 is that the outcome is set by the year the fund happens to start. The same design, run by the same rules, did well when launched in the first years of the 2000s and lost most of its sponsors’ capital when launched in the 2010s. A sponsor deciding today cannot know which lies ahead. But the Facility’s purpose, described in Chapter 7, is a payment a forest country can count on year after year, large enough and certain enough to change decisions about land; a payment that arrives in full in one year in two, and that stops for years at a time after each crisis, cannot do that work, however well it averages. What the markets offer is a chance of success. What the forests need is reliability, and there is nothing in the design that converts the one into the other.
Chance against reliability
The historical record of emerging bond returns demonstrates that the TFIF would not have achieved what is hoped for, and the current yields are inadequate to support the claims being made. A likely outcome is that the TFIF’s managers would come under pressure to take bigger risks to earn higher returns. There are many earlier instances of public institutions that, under financial pressure, tried to outsmart the market. The record of those attempts is the subject of Chapter 9, and it is not a happy one.
Appendix 8A. The simulation model
This appendix sets out the model behind Section 8.4: the data, the way the fund is built, the rules it follows and what the model leaves out. It then compares the results with the Note’s own test of its portfolio and reports what we found for a fund that hedges its interest-rate risk. It ends with the definitions used in Table 8.4 and a year-by-year account of the 2010 launch.
8A.1 Data and launches
The simulation uses three daily series from Bloomberg, from 3 January 2000 to 31 August 2026. The first is the J.P. Morgan EMBI Global total return index (JPEIGLBL), which gives the return on the fund’s emerging-market bonds. The second is an eight-year Treasury yield, which sets the coupon on the fund’s bonds and on the sponsors’ loans. There is no eight-year Treasury bond, so the yield is interpolated: 0.4 times the five-year yield plus 0.6 times the ten-year yield. The third is the Bloomberg US Treasury 7–10 Year total return index (LT09TRUU), which gives the return on the fund’s Treasury holding and is the index used in Table 8.2. The model works in calendar days. A day on which the markets are closed takes the next day’s quote.
The fund is launched on the first trading day of each year from 2000 to 2018 and run to 31 August 2026. That gives nineteen runs of between eight and twenty-six years. Each run is an alternative history of the same fund, so the runs cannot be added together; we report ranges and counts. The later launches are not comparable with the earlier ones. A fund takes eight years to build, so the 2013 launch has had less than six years at full size and the 2018 launch less than one. Their sponsors’ capital has had less time at risk, which is why more of it is left, and their forests have had fewer years of payments.
8A.2 Build-up
The fund is capitalised over eight years. Sponsor money and market borrowing arrive together every day in the ratio 1:4, about $43 million a day, until $25 billion and $100 billion have been raised. Building the fund up daily means that it buys at ninety-six months’ prices, so no launch is a bet on the spread of a single date. That is more representative than investing one eighth of the total, $15.6 billion, on one day each year.
Eight years is our assumption. Sovereign commitments are being made in instalments: Norway’s loan and Germany’s contribution are each to be paid over ten years (notes 20 and 21). The Note acknowledges that “certain sponsors wish to make contributions over a few years” (p. 35), although its own model “assumes that all sponsor funds are received at the beginning of the life of the TFIF” and its Figure 10 shows the fund at $125 billion from the fourth year. Eight years lies between these. It is also the life we assume for the fund’s bonds, so that from the ninth year the fund is in a steady state, with one eighth of its bonds falling due for refinancing each year. It is the fund at its full size that the simulation is meant to test, and a longer build-up would leave fewer years of it to observe.
8A.3 Portfolio, borrowing and costs
The proceeds are invested 90% in the EMBI Global index and 10% in Treasuries, rebalanced daily. The 10% is the buffer of liquid assets described in the Note (p. 74).
Each day’s market borrowing is an eight-year bond paying that day’s eight-year Treasury yield plus 150 bps, fixed for the life of the bond and repaid in one sum at maturity. A spread of 150 bps on the bonds is 120 bps on the whole fund, the central case in Section 8.3.2. The Note gives no maturity for the bonds beyond “an average life longer than that traditionally seen of multilateral organizations (e.g. 5+ years)” (p. 74). Sponsor loans carry the Treasury yield with no spread, as the Note specifies, and are repaid only under the rule in 8A.4.
The fund pays a management fee of 20 bps a year on its assets and an underwriting fee of 0.45% on every bond it issues, including refinancings. Together these come to about 25 bps a year, the figure assumed in Section 8.3.3. The running cost of the Facility, $60 million a year as set out in Chapter 10, is taken out of the fund’s assets at $5 million at the end of each month. It is paid first and in full whatever the state of the fund, because the Facility’s staff, boards and verification work do not stop when the market falls.
8A.4 What happens at each year end
Bond interest is paid daily. Everything else is settled once a year, on the first trading day of the following year, in this order.
Sponsor coupon. The year’s interest on sponsor loans is paid in full if, after paying it, the fund’s assets would still cover the bonds outstanding. If not, the fund pays what it can while keeping assets at least equal to the bonds, and the rest of that year’s coupon is cancelled. The Note’s term sheet for sponsor capital provides that the coupon “can be cancelled at discretion of TFIF Board or automatically when certain % loss of equity triggers are met” (§7.2.1, p. 34).
Forest Payment. The fund owes the scheduled amount for the year plus any arrears. It pays as much of this as leaves the bonds at or below 85% of assets, following the Note’s rule that “if the gearing (senior liabilities / assets) exceeds key thresholds (e.g. 85%), the payouts from the TFIF will start to be curtailed until the market normalises” (§12.1.1, Table 8). What is not paid is carried forward and paid in a later year when the limit allows. The Note provides for this: “TFCs may subsequently receive catch-up payments in later years if the TFIF’s financial performance improves” (§1.4, p. 10), and, more fully, “in subsequent years, after fulfilling the payment obligations to investors and sponsors, and covering the administrative costs of the Facility and TFIF, any additional available funds (provided they do not jeopardize the financial stability of the TFFF) will be used to compensate TFCs for the shortfall in previous years” (§10.2.1.5, p. 54, footnote 31). The Note does not say whether interest is paid on a shortfall. We assume that it is not.
Sponsor repayment. From the tenth year end, if the sponsor coupon and the Forest Payment, including arrears, have been paid in full and assets would still be at least 125% of bonds afterwards, the fund repays one thirtieth of the sponsors’ $25 billion. The Note gives the fund the “right to begin 30-year process of repaying Sponsor” after ten years (§7.2.1, p. 34). In the simulations a repayment is rare. Seventeen of the nineteen launches run long enough to reach a tenth year end, and between them they have 153 year ends at which a repayment could be made. A repayment is made at only 15 of them. Only launches before 2006 make any repayment, and the amounts are small: at most $4.2 billion of a launch’s $25 billion.
New borrowing. On the same conditions and to the same limit, the fund borrows. During the eight-year build-up it may make up any part of the $100 billion programme that it has had to repay. After the build-up it may borrow without limit, so far as its assets remain at least 125% of its bonds, so that the fund can grow as the Note’s cash-flow chart shows it growing. The Note does not say when the fund may borrow again after it has been forced to repay bonds; the condition used here is the one that governs refinancing: after the new borrowing, the fund’s assets must be at least 125% of its bonds. In the simulations the fund borrows under this rule at 25 of the 323 year ends, all of them in the six launches from 2000 to 2005 and all after the build-up was complete.
8A.5 The refinancing test
A maturing bond is refinanced only if the fund’s assets are at least 125% of its outstanding bonds. If the test fails, the bond is repaid out of assets and the fund shrinks. The figure of 125% is the structure the fund sets up at the start: $125 of assets for every $100 of bonds, which the Note calls “5x leverageable” (p. 41). The $25 of junior capital in every $125 is what protects the bondholders from loss. Investors who lent at a given rate with that protection in place will not lend at the same rate when it is much smaller. We assume that below 125% they do not lend at all.
The same test applies during the build-up. Each day’s scheduled borrowing is issued only so far as the test allows, but catch up is permitted if the fund achieves a coverage ratio of 125%.
8A.6 The payment schedule
The scheduled Forest Payment is the one in the Note’s own cash-flow projection. We measured the line for payments to forest countries in Figure 10 of Concept Note 3.1 (p. 41) year by year. Table 8A.1 gives the values for the twenty-six years the longest run needs. They agree with the Note’s text, which has payments “reaching USD 2.2 billion after the first year of full capitalization.” The line continues to about $6 billion in year 40. The Note’s line is drawn for a fund that holds its full $125 billion from the fourth year. The fund in our simulations is built up over eight years (Section 8A.2), so in its fourth year it is asked for $2.2 billion when it is half built. In those years the schedule asks more of our fund than the Note’s own model asks of its fund.
Table 8A.1. Scheduled Forest Payment by year of the fund’s life, $ billion
| Year | 1 | 2 | 3 | 4 | 5 | 6 | 7 | 8 | 9 | 10 | 11 | 12 | 13 |
|---|---|---|---|---|---|---|---|---|---|---|---|---|---|
| Payment | 0.00 | 0.79 | 1.43 | 2.17 | 2.27 | 2.36 | 2.46 | 2.54 | 2.62 | 2.71 | 2.81 | 2.90 | 2.99 |
| Year | 14 | 15 | 16 | 17 | 18 | 19 | 20 | 21 | 22 | 23 | 24 | 25 | 26 |
|---|---|---|---|---|---|---|---|---|---|---|---|---|---|
| Payment | 3.07 | 3.19 | 3.26 | 3.35 | 3.45 | 3.56 | 3.66 | 3.76 | 3.88 | 3.98 | 4.10 | 4.21 | 4.31 |
Source: Authors’ measurement from Concept Note 3.1, Figure 10, p. 41.
The schedule is fixed in advance and is not adjusted for the deforestation that occurs. The Facility is supposed to reduce deforestation, and the rising line is what the Note expects to pay as it does so. Shortfalls are carried forward, as the Note provides: “TFCs may subsequently receive catch-up payments in later years if the TFIF’s financial performance improves” (§1.4, p. 10).
8A.7 Bondholders and covenants
The model gives the bondholders no say. It lets the fund carry on when its assets have fallen below its bonds, keep paying coupons, and repay each bond at par as it matures. In all but one of the nineteen runs the bondholders are paid in full up to August 2026, but the prospects for full repayment of all bonds issued after 2018 look uncertain in many of the runs. Whether the TFIF’s bonds would allow the fund to continue if assets fell below the face value of the bonds is not known. The Concept Note sets out no covenants and no events of default for them, and the fund’s term sheet has not been published.52
Vehicles that borrow against a portfolio of securities protect their lenders in one of two ways. In a cash-flow structure, of which the collateralised loan obligation is the usual example, the tests compare the face value of the collateral with the face value of the notes. A fall in market prices does not trip them unless it comes with defaults or downgrades. When a test fails, income that would have gone to the junior investors is used to repay the senior notes until the test is met again, and, short of a failure to pay them, the senior noteholders can accelerate and liquidate only when the face value of the performing collateral has fallen to about the face value of their own notes.53 In a market-value structure the tests compare the market value of the assets with the debt. The fund is given a cure period of days or weeks, and if the breach is not cured it must sell assets and repay debt. Structured investment vehicles and market-value collateralised debt obligations were built in this way, and in 2007 and 2008 they were forced to sell or were wound up.54
The TFIF has features of both. It is to hold traded bonds, to value them daily and to measure its gearing on that value, and its own rule stops Forest Payments when its bonds exceed 85% of its assets.55 The nearest existing precedent is the International Finance Facility for Immunisation (IFFIm), which borrows against donor pledges. Its bonds are in default if its debts exceed the value of its assets for 150 consecutive days.56
Table 8A.2 gives the date on which each launch first has assets below its bonds, the number of days it spends there, and the longest unbroken spell. The launches of 2000 to 2008 first cross the line in October 2008, those of 2010 and 2011 on 19 March 2020, and the other eight between 29 April and 11 June 2022. The breaches of 2008 and 2020 are short: none lasts more than ten days. A test on face values would not have been triggered by them, and a test on market values with a cure period would probably have been met in time. The breach of 2022 is different. In the fifteen launches from 2000 to 2014 assets stay below bonds for more than 150 days without a break, beginning between April and June 2022. In the four launches from 2015 to 2018 the longest spell is between 64 and 96 days. Under a rule like IFFIm’s, those fifteen funds would have been in default in the autumn of 2022. On 21 October 2022 their assets were worth between 83% and 88% of their bonds, so a wind-down at that point would have left the bondholders with a loss, the sponsors with nothing, and the forests with no further payments.
Table 8A.2. Assets below bonds, by launch
| Launch | First day with assets below bonds | Days with assets below bonds, to August 2026 | Longest unbroken spell, days |
|---|---|---|---|
| 2000 | 21 October 2008 | 582 | 306 |
| 2001 | 22 October 2008 | 578 | 306 |
| 2002 | 22 October 2008 | 580 | 313 |
| 2003 | 22 October 2008 | 595 | 313 |
| 2004 | 22 October 2008 | 774 | 615 |
| 2005 | 22 October 2008 | 696 | 314 |
| 2006 | 22 October 2008 | 1,371 | 1,239 |
| 2007 | 22 October 2008 | 813 | 658 |
| 2008 | 22 October 2008 | 788 | 567 |
| 2009 | 6 May 2022 | 749 | 560 |
| 2010 | 19 March 2020 | 982 | 841 |
| 2011 | 19 March 2020 | 912 | 838 |
| 2012 | 29 April 2022 | 893 | 826 |
| 2013 | 6 May 2022 | 794 | 571 |
| 2014 | 6 May 2022 | 805 | 658 |
| 2015 | 7 May 2022 | 258 | 96 |
| 2016 | 10 June 2022 | 158 | 93 |
| 2017 | 11 June 2022 | 129 | 72 |
| 2018 | 11 June 2022 | 124 | 64 |
Source: Authors’ simulation. The longest spell begins in 2022 or 2023 in every launch.
8A.8 The Note’s 216 days, and interest-rate hedging
The Note reports that over twenty years its portfolio would have been worth less than 85% of its starting value on only 216 days (p. 42). The launches in Table 8A.2 spend between 124 and 1,371 days with assets below their bonds. The Note does not say how it values the portfolio. A value calculated from the EMBI Global spread alone reproduces its count closely, at 214 days below 85%. A measure of that kind leaves out two things that move the price of a portfolio of bonds: defaults, and changes in Treasury yields.
In our simulations it is Treasury yields that matter most. The tests the fund must pass compare the market value of its assets with the face value of its bonds, so a rise in Treasury yields counts against the assets and not against the bonds. Between September 2021 and October 2022 the EMBI Global lost 26.0% and the Bloomberg US Treasury 7–10 Year index lost 19.2%, while the EMBI Global spread rose only from 312 to 478 bps. On a measure that uses the spread alone, the portfolio never falls below 85% in 2022. In the simulations, 12,371 of the 12,581 launch-days with assets below bonds, or 98%, fall between 2022 and 2025.
The Note says that the risk of a fall in the value of the portfolio “will be mitigated by hedging the underlying interest rate risk of the portfolio” (p. 73). It does not say how, or at what cost. The fund in our simulations does not hedge. We also explored a fund that does. On its emerging-market bonds it gives up the return on Treasuries of similar maturity and receives a short-term interest rate, and its bonds and sponsor loans pay a floating rate. Hedging protects this fund from the rise in yields in 2022, and the launches from 2014 to 2018 deliver more of their schedule than in Table 8.4. Hedging also removes a gain. Treasury yields fell for most of the period between 2000 and 2020, and bond prices rose as they did. Over the whole period the Treasury 7–10 Year index returned 4.2% a year, and the federal funds rate averaged 2.0%. The hedged fund exchanges the first (the index) for the second (the funds rate). The launches from 2000 to 2012 deliver less of their schedule than in Table 8.4, and more of them lose all their sponsor capital.
Hedging creates a risk of its own. A fund hedged in this way must pay cash to its counterparties when Treasury yields fall, and yields fall in a crisis. In 2008 the Treasury 7–10 Year index rose 18% between 19 June and 18 December. A fund hedging $112.5 billion of bonds would have owed its counterparties roughly $18 to $20 billion in cash over those six months. The fund’s liquid holding, the tenth of its assets that it keeps out of emerging-market bonds, is $12.5 billion at full size. The rest of the cash would have had to come from selling emerging-market bonds, and by 24 October 2008 the EMBI Global had fallen 28%. The fund would have been selling bonds at depressed prices to meet the calls on its hedge.
Hedging also has costs: dealing spreads, clearing fees, the margin that must be lodged with a clearing house, and the larger holding of cash needed to meet such calls. We found no published estimate of the total for a portfolio of this kind. Our own rough estimate, built up from these components, is 10 to 45 bps a year on the amount hedged, which is about $110 million to $500 million a year for a fund at full size. The Note’s projection makes no allowance for it.
8A.9 Definitions
The columns of Table 8.4 are defined as follows. Public capital left is the sponsor capital repaid plus the sponsors’ remaining claim on the fund on 31 August 2026. The claim is assets less bonds outstanding, up to the sponsor capital still outstanding, and not less than zero. Payments to Forests are the Forest Payments made over the run, catch-up payments included. Average Payments to Forests divides this by the number of years run, from 26 for the 2000 launch to 8 for the 2018 launch. Per hectare per year is $4 multiplied by the share of scheduled payments actually made. G&A is underwriting fees, management fees and the running cost of the Facility; it does not include interest paid to bondholders or sponsors. Average G&A divides it by the years run. Net is Payments to Forests less the public capital lost, which is $25 billion less the public capital left. It is in nominal dollars and leaves out the interest paid to sponsors. A cancelled coupon is not owed, so it is not counted as a loss.
Three other terms are used in the text. The share of the schedule delivered is Payments to Forests divided by the payments scheduled over the run. Retained earnings are assets less bonds outstanding less sponsor capital outstanding; a negative figure means that part of the sponsors’ capital has been lost. Days with assets below bonds are days on which a launch’s assets are worth no more than its bonds outstanding.
8A.10 The 2010 launch, year by year
Table 8A.3 follows the fund launched on 4 January 2010, which is the one shown in Figure 8.1. Its sponsors paid in their $25 billion over eight years, and the fund borrowed alongside. It paid the forests on schedule for 2011, 2012 and 2013, $4.4 billion in all.
The sell-off of 2013 slowed the growth of the fund in this simulation. From the middle of 2013 the refinancing test held back part of the planned borrowing, and in 2015 the fund could not borrow at all: its bonds stood at $58.5 billion from January 2015 to January 2016. At the settlements for 2014, 2015 and 2016 the gearing limit capped the Forest Payment, and the fund paid $5.1 billion of the $7.1 billion due. Borrowing resumed in 2016 and the fund grew quickly, to $119 billion of assets and $95 billion of bonds in September 2017. That was its largest size. For 2017 it paid $4.5 billion, which was the scheduled amount and all of the arrears.
The first of its bonds matured in 2018. A bond can be replaced only if the fund’s assets are at least 125% of its bonds, and after 2017 they seldom were. Of the $95 billion of bonds that matured between 2018 and August 2026, $1 billion was refinanced and $94 billion was repaid out of the fund’s assets. The fund shrank every year. It paid nothing for 2018, paid $5.3 billion for 2019, which cleared the arrears, and paid 2020 in full. On one day in that period, 19 March 2020, its assets were worth no more than its bonds.
It has paid the forests nothing since. At the settlement for 2021 its bonds were already more than 85% of its assets. Its assets fell below its bonds on 28 April 2022 and stayed there without a break until 15 August 2024, with shorter spells until May 2025. At the lowest point, on 21 October 2022, it held $36.7 billion of assets against $42.7 billion of bonds. The sponsors’ coupons for 2022, 2023 and 2024 were cancelled, $1.6 billion in all. The bondholders were repaid in full as their bonds matured, $26 billion of them in 2024. At the settlement for 2025 the assets again covered the bonds, and the sponsors’ coupon of $0.7 billion was paid. In August 2026 the fund would have held $6.0 billion of assets against $5.9 billion of bonds. That leaves $0.1 billion for sponsors who are owed $25 billion, and arrears of $15.4 billion owed to forest countries. Over the whole run the scheduled payments are $37.6 billion and the payments made $22.2 billion.
Table 8A.3. The fund launched in 2010, at each year-end settlement, $ billion
| Year | Assets | Bonds | Forest Payment scheduled | Forest Payment made | Arrears carried forward | Sponsor coupon paid | Days with assets below bonds in the year |
|---|---|---|---|---|---|---|---|
| 2010 | 15.8 | 12.5 | 0.00 | 0.00 | 0.00 | 0.04 | 0 |
| 2011 | 31.7 | 24.9 | 0.79 | 0.79 | 0.00 | 0.12 | 0 |
| 2012 | 50.7 | 37.4 | 1.43 | 1.43 | 0.00 | 0.18 | 0 |
| 2013 | 56.3 | 47.7 | 2.17 | 2.17 | 0.00 | 0.22 | 0 |
| 2014 | 68.8 | 58.5 | 2.27 | 2.13 | 0.14 | 0.29 | 0 |
| 2015 | 68.8 | 58.5 | 2.36 | 1.37 | 1.13 | 0.35 | 0 |
| 2016 | 99.4 | 84.5 | 2.46 | 1.63 | 1.95 | 0.41 | 0 |
| 2017 | 113.4 | 95.2 | 2.54 | 4.49 | 0.00 | 0.46 | 0 |
| 2018 | 93.0 | 82.8 | 2.62 | 0.00 | 2.62 | 0.50 | 0 |
| 2019 | 89.8 | 76.0 | 2.71 | 5.33 | 0.00 | 0.50 | 0 |
| 2020 | 76.3 | 63.6 | 2.81 | 2.81 | 0.00 | 0.49 | 1 |
| 2021 | 62.1 | 53.4 | 2.90 | 0.00 | 2.90 | 0.47 | 0 |
| 2022 | 40.0 | 42.6 | 2.99 | 0.00 | 5.89 | 0.00 | 251 |
| 2023 | 41.9 | 42.6 | 3.07 | 0.00 | 8.96 | 0.00 | 364 |
| 2024 | 16.4 | 16.6 | 3.19 | 0.00 | 12.15 | 0.00 | 272 |
| 2025 | 6.0 | 5.9 | 3.26 | 0.00 | 15.41 | 0.66 | 91 |
Source: Authors’ simulation. Assets and bonds are after the settlement, which takes place on the first trading day of the following year. The fund was at its largest in September 2017 and never held $125 billion. Its assets were also below its bonds on three days in March 2026.
Notes
Concept Note 3.1, §1: the Facility “will provide annual, large-scale payments to up to 74 developing countries that collectively hold more than one billion hectares of tropical and subtropical moist broadleaf forests”; and §2, Figure 3(a). The $4 figure: §1.3, p. 9, “Forest Payments are currently expected to be around USD 4 per hectare of Eligible Forest, subject to annual adjustment for inflation, capped at 2% per year,” and §7.4, Figure 9, p. 39, where “$4 / Hectare” is the fixed item in the payment order.↩︎
Concept Note 3.1, §4 (deforestation cap of 0.5% at entry; discounts of 1:100 for loss up to 0.3% and 1:200 between 0.3 and 0.5%), and §7.5, p. 40: “only around 500 million hectares (under conservative estimates) will be eligible for Forest Payments at the launch of TFIF.”↩︎
Concept Note 3.1, §7.5, p. 40.↩︎
Concept Note 3.1, §7.5, pp. 40–41. Figure 10 assumes a “gross z-spread (yield over UST) of 350 bps from a BB+ sample portfolio comprised of EM bonds only,” market borrowing “at an average cost of 100 bps over UST,” and “fees and expenses adding up to 23 bps.”↩︎
Concept Note 3.1, §7.5, Figure 10, p. 41, “Projected Potential TFFF Cashflows,” read from the chart: total capital (market borrowing, sovereign investment and retained capital) rises from about $125 billion in year 4 to a little over $200 billion in year 40; sovereign investment falls from $25 billion to nil; payments to forest nations rise from about $2.2 billion in year 4 to about $4 billion in year 23 and about $6 billion in year 40 (the values we measured from the chart are given in Section 8.4). The accompanying text: “payments to TFCs reaching USD 2.2 billion after the first year of full capitalization and excess capital being retained over time. As indicated, in this case retained capital is expected to replace sovereign investment after 40 years and TFIF would hold its own equity.”↩︎
Concept Note 3.0 (September 2025), §7, p. 33. The 8.3% is sourced in the note’s footnote 20 to “Yield of JP Morgan Global EMBI spread plus the long-term US Treasury Yield (07/01/2024),” a single day’s observation.↩︎
S&P Global Ratings, 2024 Annual Global Sovereign Default and Rating Transition Study, Table 16, “Sovereign foreign currency cumulative average default rates without rating modifiers (1975–2024)”: BB, 10-year, 10.13%; speculative grade, 10-year, 23.52%. The table is by rating category without modifiers, so “BB” covers BB+, BB and BB−. The Note describes its portfolio as BB+ or BB/BB+ on average (§7.5, p. 41; §7.6, p. 41), the upper end of the category, and its own Table 6 gives BB for the portfolio with no assets outside ODA-eligible countries.↩︎
Cruces and Trebesch (2013), “Sovereign Defaults: The Price of Haircuts,” American Economic Journal: Macroeconomics 5(3): 85–117, covering 180 restructurings with foreign banks and bondholders in 68 countries, 1970–2010: the average haircut is 37% in present-value terms, with individual cases from about 10% to 90%. Meyer, Reinhart and Trebesch (2022), “Sovereign Bonds since Waterloo,” Quarterly Journal of Economics 137(3): 1615–1680, find a median creditor loss below 50% across more than 300 restructurings since 1815. A loss of half is therefore at the upper end of the record; a loss of 37% would give about 4% over the decade, or 40 bps a year.↩︎
J.P. Morgan EMBI Global total return index, peak-to-trough: 21 May to 24 October 2008, −29.3%; 15 September 2021 to 21 October 2022, −26.0%. Authors’ calculations, based on Bloomberg data (JPEIGLBL Index).↩︎
Norges Bank Investment Management, “Risk management,” key figures for the fund’s risk and exposure as at 31 December 2025: “Maximum 5% of fixed-income investments may be in emerging markets,” actual 2.5; “Maximum 5% of fixed-income investments may be rated below BBB-,” actual 1.0. The fund’s fixed-income portfolio was 26.6% of its market value on the same date.↩︎
On ratings, Jacob Assa and Aleksandr V. Gevorkyan, Reducing the Cost of Finance for Africa: The Role of Sovereign Credit Ratings (UNDP Regional Bureau for Africa, April 2023). The report compares the ratings of S&P, Moody’s and Fitch for African sovereigns with scores from a model based on macroeconomic data, and finds a number of African countries rated below the model’s score. It attributes the gaps not to bias but to “idiosyncrasies in the dominant approach of the Big Three” (Abstract; pp. 24–25), observes that “some economies may be unfairly penalized for various discretionary reasons” (p. 12), and puts the cost to African countries in excess interest and forgone funding at US$74.5 billion (p. 39). On liquidity and common factors in sovereign spreads, Longstaff, Pan, Pedersen and Singleton (2011), “How Sovereign Is Sovereign Credit Risk?” American Economic Journal: Macroeconomics 3(2): 75–103.↩︎
Concept Note 3.1, §7.6, p. 41: “To assess historic performance, the J.P. Morgan EMBI Global Spread was used as the benchmark.”↩︎
J.P. Morgan EMBI Global stripped spread (Bloomberg JPEIGLSP Index), monthly from January 2000 and daily from 30 June 2003 to 16 September 2025. Period averages weight each observation by the number of calendar days it covers, so that each monthly observation before July 2003 counts for its month. Maximum of the daily series 891bp on 24 October 2008; the monthly observations reach 1001bp at the end of October 2001; minimum 151bp on 1 June 2007.↩︎
Bloomberg JPEIGLBL Index (J.P. Morgan EMBI Global total return) and LT09TRUU Index (Bloomberg US Treasury 7–10 Year total return), daily, 3 January 2000 to 31 August 2026. The Treasury index is investable and its duration is close to that of the EMBI; the iShares funds EMB and IEF track the corresponding J.P. Morgan and Treasury benchmarks.↩︎
Annualised total returns from year-end index values (2000 from the first quote of the year), from the series in note 14. 2000–2025: EMBI Global 7.08%, Treasury 7–10 Year 4.37%. 2008–2025: 5.20% and 3.14%. Measured from 17 December 2007 (the inception date of the EMB fund) to 31 August 2026 the figures are 5.16% and 3.01%. For comparison, BlackRock reports EMB’s annualised total return since inception as 4.78% at net asset value to 30 June 2026, against 5.30% for its benchmark, the J.P. Morgan EMBI Global Diversified Core; the gap is the fund’s 39 bps fee and tracking difference (iShares EMB product page, accessed 12 September 2026).↩︎
Concept Note 3.1, §7.6, p. 42: “The EMBI has a track record for the past 20 years with approximately 5400 observations.”↩︎
The Note’s own arithmetic shows this: 160 bps of net spread plus 72 of funding cost plus 15 of expenses is 247, and 160 plus 140 plus 25 is 325, which are the two ends of the range it publishes. On $100 billion the same figures would give 233 and 297.↩︎
Concept Note 3.1, §7.2.2, p. 37, which also describes the Unsecured Option as “less complicated to set up and administer” and “cheaper,” and the Secured Option as “a more complicated and costly structure to set up and administer over time.” Equity here means paid-in capital that the sponsor owns rather than lends. The Note’s term sheet for it (§7.2.1, p. 34, “Paid-in Equity”) describes “a perpetual investment” that “pays a discretionary distribution from the TFIF balance sheet but is dependent on the financial performance of TFIF” and “ranks junior to TFIF Senior Debt.” The fund therefore owes an equity holder no interest: it pays a distribution only if its board decides it can afford one, and pays nothing otherwise without being in default. Nor does it ever have to repay the money; the sponsor’s claim is on whatever is left after the bondholders, for as long as the fund exists. That is why the Unsecured Option’s cost of capital is lower: not because the bonds are cheaper, but because the equity itself costs the fund nothing in cash, and $16.67 billion of capital that pays no coupon takes about 67 bps off the average cost of the $125 billion (note 22). A loan, even a subordinated one with a coupon that can be cancelled, is not the same thing: it has a due date and, in the ordinary course, a coupon. The Note’s second instrument, the Sponsor Capital Note, is a hybrid: a loan with a coupon that can be cancelled and an option to convert into equity after ten years. The Unsecured Option’s requirement is stated in terms of “paid in equity,” so a hybrid does not count toward it.↩︎
Concept Note 3.1, §7.2.2, p. 38.↩︎
HM Government, “Investment boost for climate action and forest protection,” 3 September 2026, describing the £400 million as a loan “subject to final due diligence.” Norway: Office of the Prime Minister, “Norwegian Government to provide up to 3 billion USD to new fund to preserve tropical forests,” 6 November 2025: “Norway will provide up to 3 billion USD in loans over ten years,” “disbursed gradually in the period up to 2035 and must be repaid by 2075,” conditional on at least $10 billion being mobilised by the end of 2026 and on Norway providing no more than 20% of the total. Brazil and Indonesia: TFFF, “Over USD 5.5 billion Announced for Tropical Forest Forever Facility,” 7 November 2025 (“Brazil and Indonesia reconfirmed their USD 1 billion commitments”); President Prabowo, 23 October 2025: “Indonesia will invest there.” Neither government has published the instrument. The $6.8 billion total is as reported in July 2026 (Climate Home News, 3 July 2026). On the pledges generally, see Chapter 13, note 22.↩︎
Federal Ministry for the Environment (BMUV), “Germany pledges one billion euros to innovative rainforest conservation fund,” press release, 21 November 2025: “Germany will provide a total of one billion euros over the next ten years for the Tropical Forests Forever Facility … The funding will come from Germany’s federal budget. They will help capitalise the fund … This commitment is still subject to approval by the German Parliament.” On the domestic opposition to the commitment, see Peter Tiede, “Schluss mit Milliarden-Geschenken,” Bild, 10 September 2026, https://www.bild.de/politik/meinung-kommentare-kolumnen/kommentar-von-chef-autor-peter-tiede-schluss-mit-milliarden-geschenken-6aa2eb0311c988e0af3e2adc, which treats the billion as a gift (“Diese Freihändig-verschenkt-Milliarden haben wir derzeit nicht”) and endorses the block placed on it by the CDU’s budget spokesman Andreas Mattfeldt (“Das Stopp des CDU-Haushälters Andreas Mattfeldt für des Kanzlers Wald-Kohle ist schon deshalb richtig”).↩︎
The 72 bps cost over Treasuries, which is achievable only in the Unsecured structure, assumes that two-thirds of sponsor capital, $16.67 billion, arrives in the form of equity, on which no interest payments are due, and the remainder in loans at the Treasury rate. At an interest rate of 5%, this means a reduction in interest payments due of around $16.67 billion × 0.05 = $0.83 billion a year, or about 67 bps on the $125 billion of capital. This is why the weighted average cost of capital is so much cheaper for the Unsecured funding model. The difference between the two ends of the Note’s range, 140 − 72 = 68 bps, is almost exactly this figure.↩︎
Concept Note 3.1, §7.2.2, p. 37, which also describes the Unsecured Option as “less complicated to set up and administer” and “cheaper,” and the Secured Option as “a more complicated and costly structure to set up and administer over time.” Equity here means paid-in capital that the sponsor owns rather than lends. The Note’s term sheet for it (§7.2.1, p. 34, “Paid-in Equity”) describes “a perpetual investment” that “pays a discretionary distribution from the TFIF balance sheet but is dependent on the financial performance of TFIF” and “ranks junior to TFIF Senior Debt.” The fund therefore owes an equity holder no interest: it pays a distribution only if its board decides it can afford one, and pays nothing otherwise without being in default. Nor does it ever have to repay the money; the sponsor’s claim is on whatever is left after the bondholders, for as long as the fund exists. That is why the Unsecured Option’s cost of capital is lower: not because the bonds are cheaper, but because the equity itself costs the fund nothing in cash, and $16.67 billion of capital that pays no coupon takes about 67 bps off the average cost of the $125 billion (note 22). A loan, even a subordinated one with a coupon that can be cancelled, is not the same thing: it has a due date and, in the ordinary course, a coupon. The Note’s second instrument, the Sponsor Capital Note, is a hybrid: a loan with a coupon that can be cancelled and an option to convert into equity after ten years. The Unsecured Option’s requirement is stated in terms of “paid in equity,” so a hybrid does not count toward it.↩︎
Concept Note 3.1, §7.5, p. 40.↩︎
Concept Note 3.1, §7.5, p. 40.↩︎
On underwriting fees: Financial Conduct Authority, Investment and corporate banking market study: Interim report, MS15/1.2, Annex 7, “Fee outcomes and international comparisons,” April 2016, Tables 7 and 8: average gross fees of 0.24% of the amount raised on AA-rated corporate bond issues, 0.34% on A-rated and 0.44% on BBB-rated, against 0.95% on BB-rated high-yield issues. A spread of 150 bps lies between the BBB and BB markets: from October 2023 to October 2026 the ICE BofA BBB US Corporate Index ranged from 92 to 163 bps over Treasuries and the BB US High Yield Index from 150 to 311 bps (Federal Reserve Bank of St. Louis, FRED series BAMLC0A4CBBB and BAMLH0A1HYBB). On the fund’s legal form and management: TFFF Transition Committee, Call for Expressions of Interest: Provision of services related to Depositary, Commercial Banking and Central Administration functions for the Luxembourg-domiciled Tropical Forest Investment Fund (TFIF), 2 July 2026: “TFIF is expected to be established as a Luxembourg-domiciled reserved alternative investment fund (‘RAIF’), in the form of a public limited company (société anonyme)”; “The Permanent AIFM may delegate portfolio management activities to one or more portfolio managers under segregated mandates across investment sleeves.”↩︎
On underwriting fees: Financial Conduct Authority, Investment and corporate banking market study: Interim report, MS15/1.2, Annex 7, “Fee outcomes and international comparisons,” April 2016, Tables 7 and 8: average gross fees of 0.24% of the amount raised on AA-rated corporate bond issues, 0.34% on A-rated and 0.44% on BBB-rated, against 0.95% on BB-rated high-yield issues. A spread of 150 bps lies between the BBB and BB markets: from October 2023 to October 2026 the ICE BofA BBB US Corporate Index ranged from 92 to 163 bps over Treasuries and the BB US High Yield Index from 150 to 311 bps (Federal Reserve Bank of St. Louis, FRED series BAMLC0A4CBBB and BAMLH0A1HYBB). On the fund’s legal form and management: TFFF Transition Committee, Call for Expressions of Interest: Provision of services related to Depositary, Commercial Banking and Central Administration functions for the Luxembourg-domiciled Tropical Forest Investment Fund (TFIF), 2 July 2026: “TFIF is expected to be established as a Luxembourg-domiciled reserved alternative investment fund (‘RAIF’), in the form of a public limited company (société anonyme)”; “The Permanent AIFM may delegate portfolio management activities to one or more portfolio managers under segregated mandates across investment sleeves.”↩︎
iShares J.P. Morgan USD Emerging Markets Bond ETF (EMB): expense ratio 0.39%, net assets $14.43 billion at 4 September 2026. iShares 7–10 Year Treasury Bond ETF (IEF): expense ratio 0.15%. IEF is the equivalent fund referred to in the text: like EMB it tracks an index without active management, and the two have similar durations (note 47). Product pages accessed 8 September 2026. These are retail funds so their pricing reflects that; we could expect an institution such as the TFIF to obtain sharper pricing, but actively managed funds are much more expensive than index funds.↩︎
Concept Note 3.0, §7, p. 33.↩︎
Authors’ simulation, based on daily Bloomberg data for the J.P. Morgan EMBI Global total return index (JPEIGLBL Index), a synthetic eight-year Treasury yield (0.4 × 5-year + 0.6 × 10-year) and the Bloomberg US Treasury 7–10 Year total return index (LT09TRUU Index). See Appendix 8A.1.↩︎
Germany’s one billion euros is to be paid over ten years (note 21); the United Kingdom’s £400 million is subject to due diligence (note 20); Norway’s loan is to be disbursed over ten years (note 20). The reasons for an eight-year build-up are given in Appendix 8A.2. Market borrowing is assumed to be possible only subject to the maintenance of an asset : borrowing ratio of 125%.↩︎
Concept Note 3.1, §7.2.1, p. 34, term sheet for Sponsor Capital Notes, item 3; the same wording appears for sponsor loans. A cancelled coupon is not owed, so it is not counted in the sponsors’ loss in Table 8.4.↩︎
Concept Note 3.1, §12.1.1, Table 8. “5x leverageable” is at §7.5, p. 41.↩︎
Concept Note 3.1, §1.4: “TFCs may subsequently receive catch-up payments in later years if the TFIF’s financial performance improves.”↩︎
Concept Note 3.1, §7.2.1, p. 34, term sheet for Sponsor Capital Notes, item 5: “After 10 years, Sponsor has right to begin 30-year process of converting into equity of TFIF, TFIF has right to begin 30-year process of repaying Sponsor with new contributions or possibly retained capital.” The Note does not say when the fund may re-borrow after a forced deleveraging; the condition used here is the same 125% cover that governs refinancing.↩︎
S&P Dow Jones Indices, SPIVA U.S. Scorecard, Year-End 2024, Report 11a: share of Emerging Markets Debt funds underperforming the Bloomberg Emerging Markets USD Aggregate index, 85.25% over ten years and 100.00% over fifteen years.↩︎
Concept Note 3.1, §12.1.1, Table 8.↩︎
Authors’ calculations, based on the simulation described in note 30. Each repayment is $833 million, pro rata across the sponsor tranches; the borrowing is the amount that leaves assets at 125% of bonds after the 0.45% underwriting fee. At the January 2013 settlement the launches of 2000 to 2005 borrow $73.4, $80.2, $80.2, $58.7, $51.7 and $43.9 billion; over the whole run they borrow $147, $176, $171, $85, $58 and $64 billion beyond the original programme.↩︎
Authors’ calculations, based on the simulation described in note 30. Market bonds outstanding in August 2026 are $93.7, $128.3 and $128.6 billion for the 2000–2002 launches; $71.2 and $53.9 billion for 2003 and 2004; between $5.9 and $20.7 billion for the 2005–2012 launches; and between $25.1 and $60.9 billion for the 2013–2018 launches. The launches from 2011 on raised less than the full $100 billion (between $67 and $95 billion), because the refinancing test held back part of their borrowing. Peak bonds outstanding, measured at the start of each month, range from $56 billion (2017 launch) to $238 billion (2001 and 2002 launches).↩︎
Concept Note 3.1, §7.6, p. 43, and Table 6, which gives probabilities of a sponsor coupon skip of 10.58, 7.58 and 4.48%, and of capital impairment of 1.14, 0.68 and 0.24%, for portfolios with 0, 10 and 25% of assets outside ODA-eligible countries. Concept Note 3.0 (pp. 42–43, Table 6) gave five further rows for the same three portfolios, among them “Probability of a TFC Payment Skip” (60.22, 59.10 and 59.8%), “Expected Payout” (97.85, 98.15 and 98.34%) and “Cash per ha (pre-Inflation)” ($3.91, $3.92 and $3.93), with the sentence: “For the TFCs, we assess that there is a 60% probability that during the life of the TFIF there is a need to reduce the Forest Payment, however any such reduction would be small with the expected payout at between 97.8% and 98.3% in each case.” Neither the rows nor the sentence appear in Concept Note 3.1. (The pages of Concept Note 3.1 still carry the running header “Concept Note 3.0.”)↩︎
Concept Note 3.1, §7.6, p. 42, and Table 5.↩︎
Authors’ calculations for the 2010 launch, based on the simulation described in note 30. The year-by-year figures are in Appendix 8A.10 and Table 8A.3.↩︎
Authors’ calculations, based on the simulation described in note 30: totals over the run of the 2010 launch of market interest paid, underwriting and management fees paid, sponsor interest paid and Forest Payments made, $26.8, $2.3, $4.7 and $22.2 billion. Fees are the model’s 20 bps management fee and 0.45% underwriting fee.↩︎
On the growth of the asset class: Meketa Investment Group, “Emerging Market Debt,” white paper, February 2023, p. 1: “Before the late 1980s, institutional investment in emerging market debt was virtually nonexistent,” and its investors “now commonly include institutional investors such as pension funds and endowments.” S. Arslanalp, D. Drakopoulos, R. Goel and R. Koepke, “Benchmark-Driven Investments in Emerging Market Bond Markets: Taking Stock,” IMF Working Paper 20/192, 2020: “Since 2007, the number of countries in the EMBIG has doubled to more than 70.” K. Miyajima and I. Shim, “Asset managers in emerging market economies,” BIS Quarterly Review, September 2014: the assets of emerging-market bond funds “quadrupled from $88 billion to $340 billion” between the end of 2009 and the end of 2013. The returns are the authors’ calculations from the series in note 30: the EMBI Global returned 10.5% a year and the Bloomberg US Treasury 7–10 Year index 6.8% from 3 January 2000 to 31 December 2009, and 4.9% and 2.7% from 4 January 2010 to 31 August 2026.↩︎
Concept Note 3.1, §7.5, pp. 40–41. Figure 10 assumes a “gross z-spread (yield over UST) of 350 bps from a BB+ sample portfolio comprised of EM bonds only,” market borrowing “at an average cost of 100 bps over UST,” and “fees and expenses adding up to 23 bps.”↩︎
Concept Note 3.0 (September 2025), §7, p. 33. The 8.3% is sourced in the note’s footnote 20 to “Yield of JP Morgan Global EMBI spread plus the long-term US Treasury Yield (07/01/2024),” a single day’s observation.↩︎
iShares EMB and IEF product pages, accessed 8 September 2026. EMB (iShares J.P. Morgan USD Emerging Markets Bond ETF, which tracks the J.P. Morgan EMBI Global Diversified Core Index): average yield to maturity 6.45%, effective duration 6.46 years, weighted average maturity 10.62 years, as of 4 September 2026. IEF (iShares 7–10 Year Treasury Bond ETF): average yield to maturity 4.73%, effective duration 6.95 years, weighted average maturity 8.49 years, as of 4 September 2026. The 30-day SEC yields on the same date were 5.97% and 4.58%, a gap of 139 bps, which would make the arithmetic in this section worse.↩︎
State Street Investment Management, Emerging Market Debt Market Commentary: August 2026, published 16 September 2026 (“the overall EMBI GD spread tightened by 10bps in August, to around 235bps”; yield 7.20% at 31 August 2026); July 2026 (EMBI Global Diversified spread 244bp and yield 7.26% at 31 July 2026, spread up 9bp in the month); Q2 2026 (235bp and 6.92% at 30 June 2026, spread 53bp tighter over the quarter; “spreads retraced to historically tight levels” in May); Q1 2026 (289bp and 7.31% at 31 March 2026, after widening of about 35bp in the quarter); February 2026 (259bp and 6.66% at 28 February 2026: “Having hovered around multi-year lows through much of February, EMD hard currency sovereign spreads widened late in the month as a risk-off tone began to grip global financial markets”). The Q2 commentary’s full sentence is: “By May, the recovery had become more differentiated: the US dollar regained ground, local currency performance turned uneven, and hard currency spreads retraced to historically tight levels.” The Diversified index gives more weight to smaller issuers than the EMBI Global the Note uses, the fund’s version of it excludes the smallest and least liquid issues, and a stripped spread measures each bond against its own Treasury rather than one fund against another.↩︎
From the series in note 13: the spread was below 247bp on 8.2% of days, 99% of them between 2005 and 2007; its average over January 2000 to September 2025 was 400bp, each observation weighted by the days it covers. The Concept Note 3.0 footnote cites the spread on “07/01/2024”; the EMBI Global stripped spread was 336–344bp on 5–8 January 2024 and 349bp on 1 July 2024, so the reading of the date does not matter.↩︎
State Street Investment Management, Emerging Market Debt Market Commentary: August 2026, published 16 September 2026 (“the overall EMBI GD spread tightened by 10bps in August, to around 235bps”; yield 7.20% at 31 August 2026); July 2026 (EMBI Global Diversified spread 244bp and yield 7.26% at 31 July 2026, spread up 9bp in the month); Q2 2026 (235bp and 6.92% at 30 June 2026, spread 53bp tighter over the quarter; “spreads retraced to historically tight levels” in May); Q1 2026 (289bp and 7.31% at 31 March 2026, after widening of about 35bp in the quarter); February 2026 (259bp and 6.66% at 28 February 2026: “Having hovered around multi-year lows through much of February, EMD hard currency sovereign spreads widened late in the month as a risk-off tone began to grip global financial markets”). The Q2 commentary’s full sentence is: “By May, the recovery had become more differentiated: the US dollar regained ground, local currency performance turned uneven, and hard currency spreads retraced to historically tight levels.”↩︎
The S&P 500 “fell 57 percent from its October 2007 peak to its trough in March 2009” (Robert Rich, “The Great Recession,” Federal Reserve History, 22 November 2013); the maximum drawdown of the MSCI World Index over the same months was 54% (Walter Scott, “Downside protection – the other side of the return equation,” 26 June 2025). The FTSE Nareit All Equity REITs Index “fell from a high of 10,256 in January 2007 to a low of 3,337 in February 2009, a cumulative loss of 67%” (Libo Sun, Sheridan Titman and Garry Twite, “REIT and Commercial Real Estate Returns: A Post Mortem of the Financial Crisis,” May 2013, p. 1).↩︎
Concept Note 3.1, §7.2.2, pp. 36–37, and §12.1, pp. 73–74. The Facility’s call for expressions of interest from service providers, 2 July 2026 (note 27), says: “For confidentiality reasons, the Fund’s term sheet will be provided to vetted applicants upon request.”↩︎
Larry Cordell, Michael R. Roberts and Michael Schwert, “CLO Performance,” Journal of Finance 78(3), June 2023, pp. 1235–1278, at p. 1237: “coverage tests are based on par values and credit ratings instead of market prices. Consequently, market volatility does not cause the diversion of cash flows to pay down debt tranches unless the volatility coincides with rating downgrades and defaults.” The same paper reports that at the end of 2008 the median AAA-rated tranche had a coverage ratio of 0.91 at market value (p. 1259). For the terms themselves see, for example, the indenture of JMP Credit Advisors CLO III(R) Ltd., 20 February 2018, filed with the US Securities and Exchange Commission: §11.1(a)(i) diverts interest proceeds “to the extent necessary” to cure a failed coverage test; §5.1(e) makes it an event of default if the principal amount of the collateral, with defaulted obligations at market value, falls below 102.5% of the Class A notes; §5.2 and §5.5 allow a majority of the senior class to accelerate, and a supermajority of it to direct the sale of the assets.↩︎
Financial Crisis Inquiry Commission, The Financial Crisis Inquiry Report, January 2011, pp. 252–253: structured investment vehicles “marked those assets to market prices daily or weekly”; of four named vehicles, “each of these four was forced to restructure or liquidate” between August and October 2007; and “as of fall 2010, not a single SIV remained in its original form.” Moody’s Investors Service, “2008 U.S. CDO Outlook and 2007 Review,” 3 March 2008, p. 7: market-value collateralised debt obligations “were forced to at least partially liquidate assets in order to maintain required overcollateralization ratios.” On cure periods and mandatory deleveraging in the rated debt of closed-end funds: Fitch Ratings, “Exposure Draft: Global Closed-End Funds and Market Value Structures Rating Criteria,” 19 August 2020.↩︎
Concept Note 3.1, §12.1, p. 73 (the 85% gearing rule). TFFF, “Financial Q&A,” 23 October 2025, question 7: the TFIF “will daily assess the value of its asset portfolio.”↩︎
International Finance Facility for Immunisation Company, Global Debt Issuance Programme, Base Prospectus, 2025, p. 79: “IFFIm Gearing Ratio Default: If on any day the IFFIm Gearing Ratio exceeds 100 per cent. and remains above 100 per cent. on each of the 150 calendar days following such day.” On such an event the trustee must declare the notes due if holders of one fifth of them so request. IFFIm’s ratio compares its net debt with the present value of its donor pledges and other assets, not with a portfolio of traded securities.↩︎